Written by: Regina Chi, CFA® | AGF
Emerging market (EM) countries exhibit great diversity and fragmentation, leading to a high dispersion in returns. We found conventional theories and tools created for developed market investing and predicated on the assumption that markets are efficient often do not work in the face of localized markets that exhibit more idiosyncratic characteristics. Therefore, we believe a disciplined, systematic, multi-factor approach to country allocation can help identify market inefficiencies and contribute substantially to outperformance over a full market cycle.
Why Country Matters
Country selection currently explains a quarter of returns
Country selection remains a significant source of alpha generation in global portfolios even though economic integration and globalization have reshaped the global economy over the past 20 years. On average, from March 31, 2004 to March 31, 2021, country selection explained approximately 30% of returns for the MSCI Emerging Markets Index. (Figure 1).1
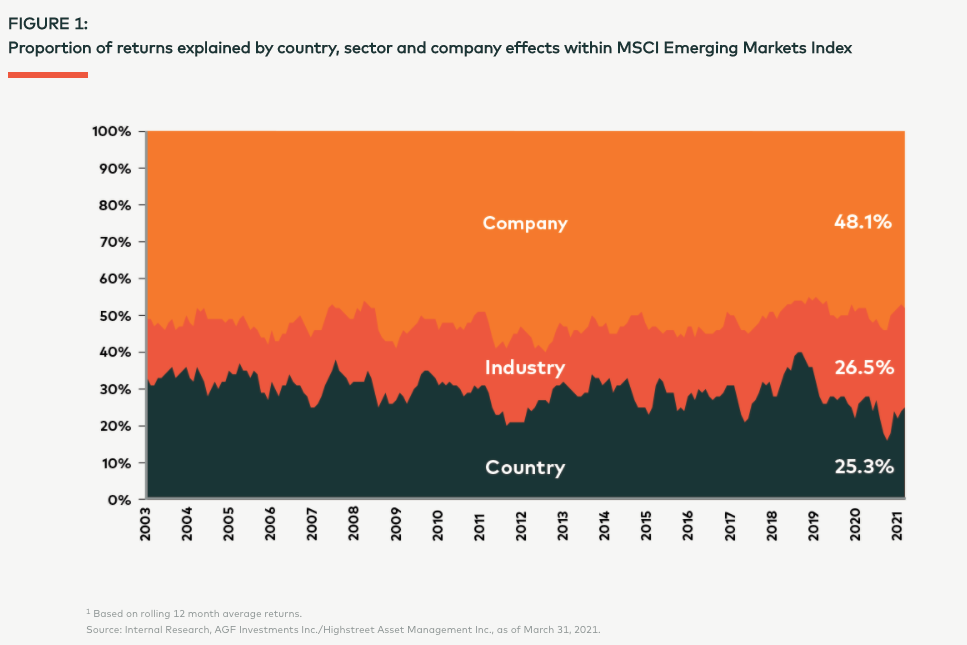
With signs of globalization peaking, and as economic and social forces give rise to protectionism, we believe idiosyncratic country factors will likely become even more important in explaining returns. The decoupling of markets can ultimately lead to the regionalization of economies, causing individual country returns to become increasingly uncorrelated with each other. We expect these evolving dynamics to present greater opportunities to outperform though country selection, particularly through countries that are more isolated from these trends.
What Causes Mispricing in Emerging Markets
Capital Controls
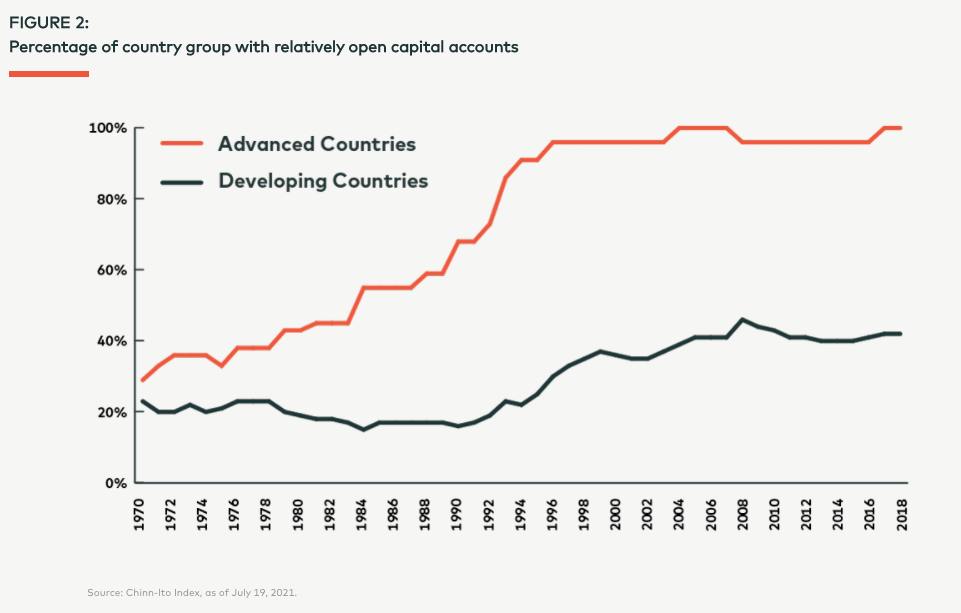
We recognize that multiple factors can contribute to the pricing of global markets, including, but not limited to, monetary and fiscal policy, current account balance (surplus/deficit), political environment, capital flows and economic growth. However, an often overlooked consideration that contributes to the mispricing of markets is the prevalence of higher capital controls in developing countries. Despite a longer-term trend towards capital account liberalization, particularly amongst advanced economies (Figure 2), the majority of emerging market countries still rely on regulatory and capital control restrictions that can create a structural bias towards their home market.
For instance, in India, pension funds are prohibited from investing offshore. Despite a tenfold increase in assets under management (AUM) for equities in India from Rs 1.1 trillion in 2009 to Rs 11.3 trillion in 20212, most of these assets remain captive within the country, leading India’s stock market to trade at a premium relative to the MSCI Emerging Markets Index. Similarly, China’s asset management industry has experienced a ninefold increase in total AUM from RMB 2.0 trillion in 2018 to RMB 18.0 trillion in 2020.3Given that offshore transactions in China are limited to US$50,000 per citizen per annum, the vast majority of this AUM is restrained domestically, leaving investors with limited alternative investment opportunities aside from their home market. These controls partially explain the historical price disparity between China’s onshore (A-share) and offshore (H-share) equity markets, with the A-shares of dual-listed companies on average trading at an approximate 22% premium relative to their corresponding H-shares.4 Another example is in South Africa where domestic funds are permitted to invest up to 30% offshore as long as they commit to investing an additional 10% in continental Africa (outside of South Africa). We believe that these structural restrictions create inefficient stock markets which can lead to sustained periods of over or undervaluation and mispricing. This can in turn create potential opportunities for global investors that have the skill to identify underpriced markets using relative valuation, growth and risk attributes.
Market Fragmentation
Emerging market (EM) countries, generally defined as those that are on the path to becoming an advanced or developed market country, are often regarded as a homogeneous asset class by investors. While it is true that certain countries such as China and South Korea constitute a significant portion of the MSCI Emerging Market Index at approximately 38% and 13%5, respectively, we believe the view of EM as a homogeneous, single asset class is misguided. We believe idiosyncratic characteristics of each country, including demographics, economics and governance, all support the case for why EM countries should be viewed on an individual basis. This is visually evident in Figure 3, which shows the high dispersion of returns across various EM countries over a 5-year time horizon.
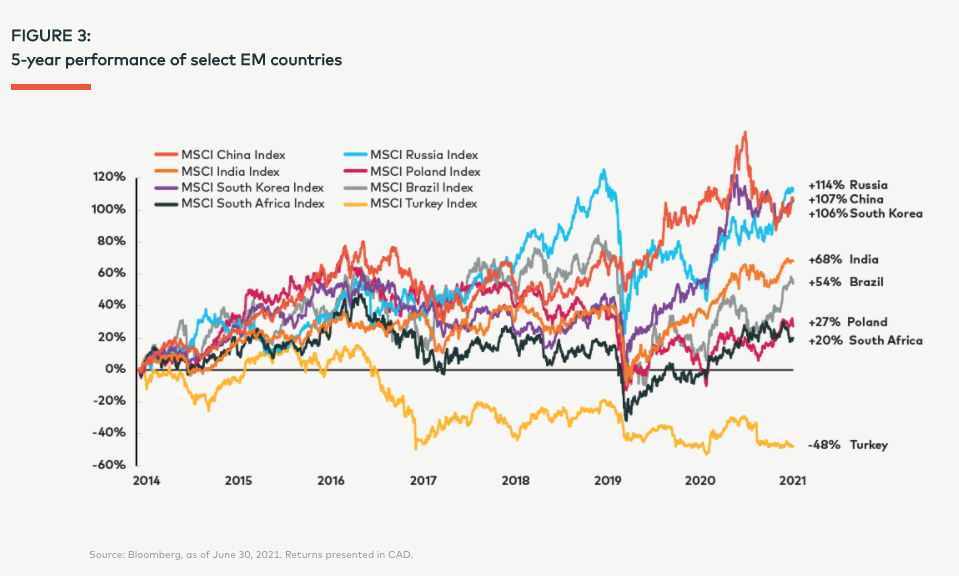
One explanation for this high dispersion is the desynchronization of business cycles across emerging markets, which leads to divergences in economic agendas and monetary policies. For example, in 2018, Turkey was faced with a currency and debt crisis, characterized by a significant decline in the Turkish lira, high inflation and rising borrowing costs and loan defaults, which resulted in a 41% decline in Turkey’s stock market.6 During the same year, China was in the midst of an escalating trade war with the U.S. as it strived to bolster economic growth through domestic policy support. In 2020, South Korea, Taiwan and China were among the best performing countries across the emerging and developed markets during the COVID-19 pandemic, as they responded swiftly to control the initial outbreak and began their economic recoveries.
Another cause of broad divergences are macro-political risks, particularly in light of the increasing frequency and intensity of political/economic crises across emerging markets since the 2008-2009 Global Financial Crisis. As an illustration, in 2016, Brazil’s overall GDP contracted by 3.6% after eight consecutive quarters of economic contraction. Despite its lackluster economy, Brazil was one of the best performing stock markets in 2016 owing to the impeachment of former president Dilma Rousseff over her violation of budgetary laws and subsequent corruption charges. As a result, Brazil’s stock market surged 67% that year leading to a significant decoupling from the rest of emerging markets.
The aforementioned examples help demonstrate the wide-ranging diversity and fragmentation across EM, which culminate in divergent returns. It is our experience that conventional theories and tools created for developed market investing and predicated on the assumption that markets are efficient often do not work in the face of localized markets that exhibit more idiosyncratic characteristics. Therefore, we believe a disciplined approach to evaluating these considerations and pursuing country selection can help turn these differences into attractive risk-adjusted investment opportunities.
To read the full article download the PDF
Related: When Will Inflation Lift Off?
1 Based on rolling 12 month average returns.
2 Association of Mutual Funds in India, figures referenced as of March 31, 2009 and June 30, 2021.
3 KPMG Celebrating 20 years of asset management in China, June 2018. China Banking Association, January 26, 2021.
4 HSBC research report, as of October 14, 2020.
5 Bloomberg, as of June 30, 2021.
6 Bloomberg, returns references in US$, as of June 30, 2021.
The commentaries contained herein are provided as a general source of information based on information available as of July 21, 2021 and should not be considered as personal investment advice or an offer or solicitation to buy and/or sell securities. Every effort has been made to ensure accuracy in these commentaries at the time of publication; however, accuracy cannot be guaranteed. Market conditions may change and the manager accepts no responsibility for individual investment decisions arising from the use of or reliance on the information contained herein. Investors are expected to obtain professional investment advice.
AGF Investments is a group of wholly owned subsidiaries of AGF Management Limited, a Canadian reporting issuer. The subsidiaries included in AGF Investments are AGF Investments Inc. (AGFI), AGF Investments America Inc. (AGFA), AGF Investments LLC (AGFUS) and AGF International Advisors Company Limited (AGFIA). AGFA and AGFUS are registered advisors in the U.S. AGFI is registered as a portfolio manager across Canadian securities commissions. AGFIA is regulated by the Central Bank of Ireland and registered with the Australian Securities & Investments Commission. The subsidiaries that form AGF Investments manage a variety of mandates comprised of equity, fixed income and balanced assets.
The MSCI information may only be used for your internal use, may not be reproduced or redisseminated in any form and may not be used as a basis for or a component of any financial instruments or products or indices. None of the MSCI information is intended to constitute investment advice or a recommendation to make (or refrain from making) any kind of investment decision and may not be relied on as such. Historical data and analysis should not be taken as an indication or guarantee of any future performance analysis, forecast or prediction. The MSCI information is provided on an “as is” basis and the user of this information assumes the entire risk of any use made of this information. MSCI, each of its affiliates and each other person involved in or related to compiling, computing or creating any MSCI information (collectively, the “MSCI Parties”) expressly disclaims all warranties (including, without limitation, any warranties of originality, accuracy, completeness, timeliness, non-infringement, merchantability and fitness for a particular purpose) with respect to this information. Without limiting any of the foregoing, in no event shall any MSCI Party have any liability for any direct, indirect, special, incidental, punitive, consequential (including, without limitation, lost profits) or any other damages. (www.msci.com)
Referenced performance is hypothetical and for illustrative purposes only. Trading costs and other fees associated with the portfolios are not included and trading prices and frequency implicit in the hypothetical performance may differ from what may have actually been realized at the time given prevailing market conditions. This performance simulation is for illustrative purposes only and does not reflect actual past performance nor does it guarantee future performance. Figures refer to simulated past performance and past performance is not a reliable guide to future performance. These figures are estimates only.
This report may not be reproduced (in whole or in part), transmitted or made available to any other person without the prior written permission of AGF Investments Inc.