Written by: Darren Williams and Guy Bruten
Disruptions and dislocations associated with COVID-19 mean current economic data may not be a reliable guide to the future. But by turning to the past, we find compelling evidence that inflation regime change is accelerating.
Secular shifts in inflation inevitably come as a shock, given that expectations are anchored by recent experience. And forecasts of change—whether up or down—face a high degree of skepticism. Rightly so—regime shifts don’t happen that often. But they do happen. And reviewing long-run historical data provides important insights that can help us identify when a significant change could be underway. In our view, evidence of a shift is accumulating before our eyes.
Today, we’re inclined to think of low inflation as both normal and desirable. Indeed, most investors in developed markets—except for the few who can remember the 1970s—have no lived experience of high inflation. But taking a longer perspective, it’s clear that the rate of inflation has varied considerably over time, depending crucially on the prevailing policy regime.
Lessons from Past Inflationary Periods
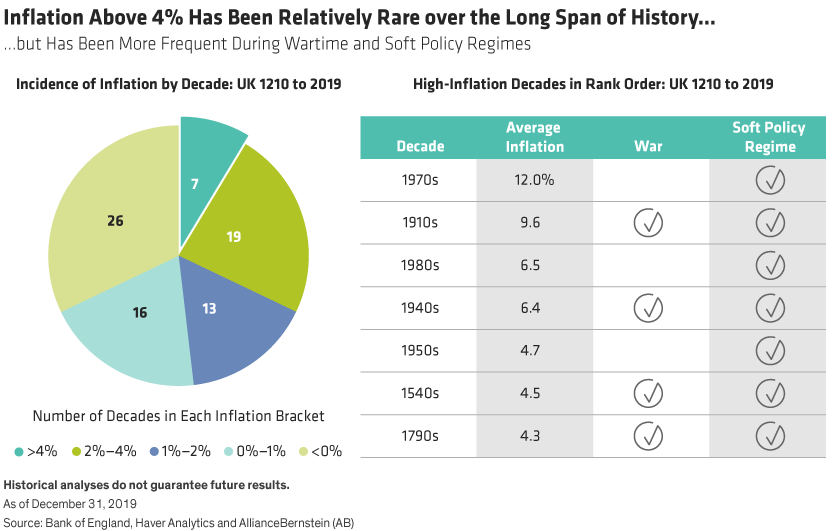
Inflation data from the Bank of England (starting in the 1200s) provide valuable insights into the causes and persistence of inflation regimes. They clearly show an ebb and flow, with inflationary and deflationary periods alternating over long periods. Data also reveal that low inflation is the norm—periods of high inflation (say, above 4%) are unusual. In fact, in the last eight centuries, there have been just seven decades in which UK inflation has averaged more than 4%. For comparison, the average rate of UK inflation has been negative in 26 decades (Display, below).

Still, high inflation has become more frequent since the fiat/paper money era began in the 20th century. In fact, five of the seven episodes of high inflation have occurred in the last 110 years. That leaves just two decades before 1910 in which inflation averaged more than 4%:
- The 1540s, when Henry VIII’s lavish lifestyle and wars with France, Scotland and Ireland put a huge strain on public finances and led to the Great Debasement, a period in which the precious-metal content of the coinage was reduced.
- The 1790s, when pressures created by the Napoleonic Wars led to the Bank Restriction Act of 1797, which suspended the Bank of England’s legal obligation to redeem its liabilities in gold.
What do the seven inflationary periods have in common? We see two recurring themes: war-related pressure on public finances (present in four high-inflation decades) and soft monetary regimes (present in all seven high-inflation decades).
Regime Shifts Determine Inflationary Outcomes
The key role that monetary regimes play in determining longer-term inflation outcomes becomes clear if we track their relationship through time. For most of the period between 1700 and the outbreak of WW1 in 1914, the value of the British pound was linked to gold—a tight policy regime. While the price level was highly volatile during this period, there was little or no net inflation except in the years when gold convertibility was suspended—namely, the restriction mentioned above (Display, below).

Although the suspension of gold convertibility lasted from 1797 to 1821, the period after Napoleon’s defeat in 1815 was used to prepare for the reintroduction of convertibility, including a reduction in note issuance. Between 1797 and 1815, inflation averaged 2.7%, and at its peak in 1813, the price level was 73% higher than in 1797. Between 1816 and 1821, by contrast, inflation averaged –5.2%.
A similar pattern emerges during the 20th century. At the beginning of WW1, the UK loosened the link to gold, and inflation surged. After the war, the government restored the link to gold, and inflation turned negative (in sharp contrast to the hyperinflation that overwhelmed paper-money regimes in Germany, Hungary and Austria). The UK government finally abandoned the gold standard in 1931, after which inflation started to rise again, before accelerating sharply during WW2.
Post-WW2, there were two notable policy regimes. The first occurred during the immediate postwar decades, when Keynesian policies dominated and the UK experienced its first sustained period of high peacetime inflation (6.5%, on average, between 1946 and 1979). The second regime began at the end of the 1970s, with the introduction of monetary targeting, and the subsequent adoption of inflation targeting (1992) and Bank of England independence (1997). Since 1997, UK inflation has averaged 1.9%.
When we review the whole period from the end of the restriction in 1821 to 2018, we can see two distinct phases. In the 93 years between the end of the restriction in 1821 and the beginning of WW1, with the British pound linked to gold, the price level declined by 1.1% (essentially unchanged). In the 100-year period after the end of WW1, with paper money the norm, the UK price level increased 38-fold.
How can we account for this huge difference?
Both phases involved technological change, positive and negative demographic trends, and the back-and-forth of globalization. Yet the price level was stable in the first and rose enormously in the second. We believe the common thread is clear: changes in the underlying policy regime presage changes in inflationary conditions. Now, as governments struggle to repair the economic damage from COVID-19, manage massive debt levels and address the urgent challenge of climate change, once-in-a-generation policy change is underway, opening the door to higher inflation.
Related: Can Advances in Technology Keep a Lid on Inflation?
