
Trending

If you follow me on Twitter then you may have seen my typical weekend tweet about how people are really missing out if they aren’t using Commitment of Traders (COT) data.
There’s few better tools that give real insight into the sentiment of the market by literally showing how various trading groups are positioned. Other sentiment sources rely on polling but COT data shows us where investors are putting their dollars. At the end of the day the market is driven by supply and demand and COT data can show us where demand is rising and when it begins to reverse direction. Like all things, nothing is a holy grail or provides perfect foresight but by utilizing this weekly data source, which is freely available online, I believe traders can get a better grasp on what’s taking place below the surface.
What is it?
Each week the Commitment of Traders report is released by the Commodity Futures Trading Commission (CFTC) and can downloaded directly from their website or accessed via various charting platforms such as Optuma, BarCharts, and Finviz. The data is broken down into trader classifications: Small Traders (often retail traders buying and selling odd lots), Large Traders (institutions, trend followers, money managers), and Commercial Traders (Actual users of the commodity who are trading to hedge as well as banks and broker-dealers for financial futures).
Why is this data useful?
Well when it comes to Commercial Traders, who do you think knows the most about corn or crude oil? Would it be Tommy, a college student trading futures between classes or Exxon Mobil and Monsanto trading to hedge exposure? My bet is on the companies fully intrenched and actual users of the underlying commodity. Because the CFTC separates Tommy’s trades from Exxon’s, we can see how Small Traders are positioned compared to Commercial Traders or how CTA/Large Traders are riding a trend. That’s valuable information in my eyes!
Now let’s look at some examples of how I utilize COT data in my charting and analysis.
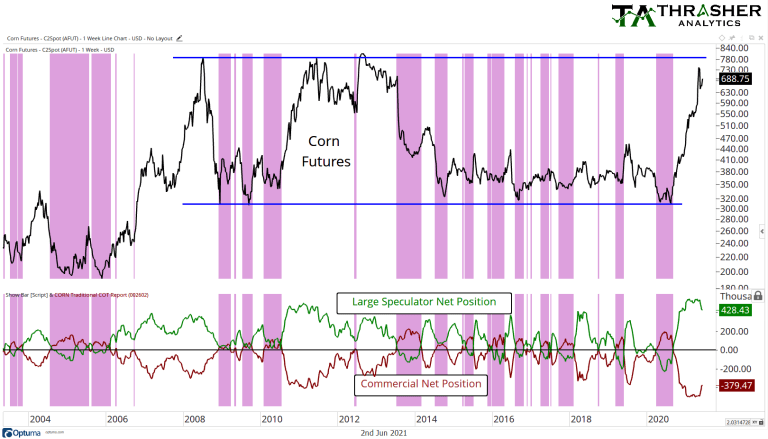
First, a chart of corn futures
Here we’re looking at the net position (total number of contracts long minus number of contracts held short) for Large Speculators and Commercial Traders. Because Commercial Traders often have large exposure to the underlying commodity within their actual business, they spend most of the time short the commodity, hedging that exposure. However, sometimes they drop that hedge all the way to zero and even become net-long, a sign they are much less concerned about the commodity price going down and not needing a large hedge. I’ve plotted purple lines on the chart below whenever Commercial Traders net position was positive, meaning they were actually net-long Corn futures. Look what often followed after Commercial Traders (often deemed the “smart money”) become net-long, corn prices often rose. We saw an example of this in 2020 before corn prices went on a massive move higher!
Commercial Traders being net-long alone isn’t enough in my opinion to turn bullish on an asset, but when combined with other forms of analysis it can paint a much clearer picture of where price may be headed.
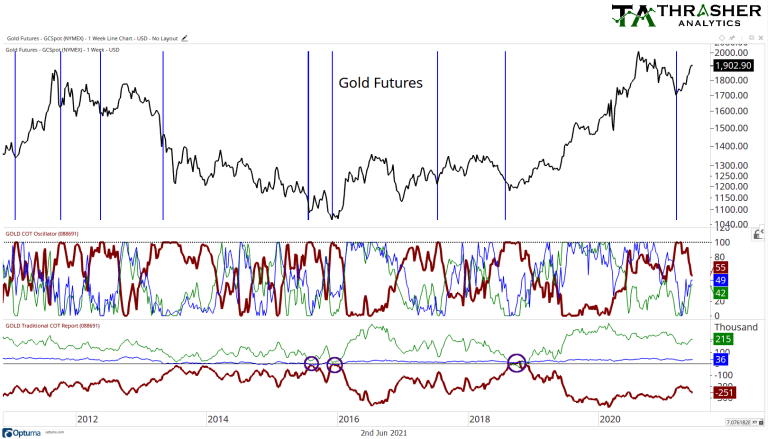
Next let’s take a look at Gold Futures
Like Corn, Commercial Traders are almost always net-short gold. I’ve marked three circles in the bottom panel when they got net-long or got really close, each marking a pretty good low in gold prices.
But another way we can look at COT data is comparing the various trading groups to their prior positions, using a percentile. In this case I’m again focusing in on Commercial Traders and when their net position gets to a 52-week high (100th %tile) and that’s where each blue vertical line signifies. While Commercial Traders may still be net-short, they are holding less of a short-bias compared to the past 12-months and that’s often been bullish for gold. I shared this chart with subscribers of my Thrasher Analytics letter when gold was near $1700/oz.
Understanding the historical positioning of the various trading groups can tell us if they are leaning more bullish or bearish on an asset compared to the last 1, 3, 5 years or whatever you’d like the lookback period to be.
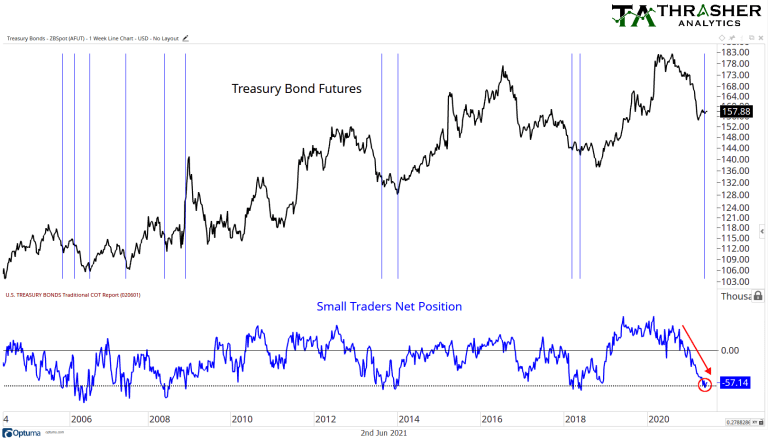
Small Traders As Contrarian Signals
Let’s look at an example of how to use one of the other groups of traders, this time the Small Traders. This group is made up of traders that are trading very small size, often odd lots and are mostly viewed as contrarian -meaning when at extremes they are often wrong (not always but pretty often!)
Below is a chart of Treasury Bond futures and the net position of Small Traders. The blue lines on the chart show when this groups net position has been at the current level going back to 2006. Currently, Small Traders HATE bonds. They have built up a large net-short position, the largest since 2018. How have bonds done in the past when Small Traders hated them? Actually pretty well. Again, this is just one input into an overall process but look when they were this short over the last 10+ years, many times a low in bonds was formed not too soon after.
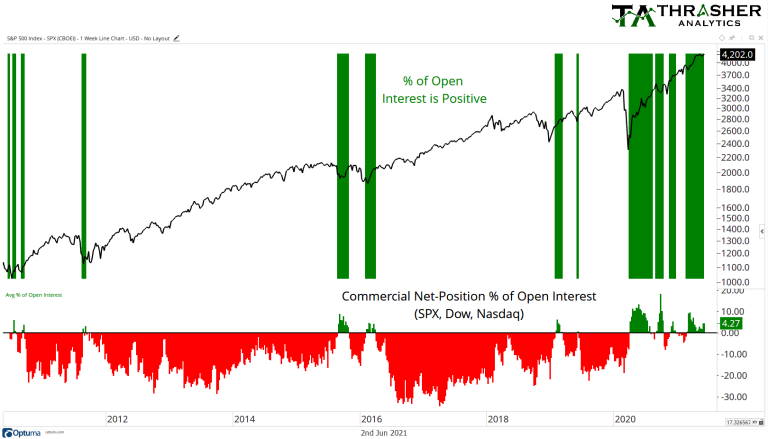
Finally let’s take a look at financial futures, grouping them all together.
The chart below looks at the Commercial net position as a percentage of total open interest. Open interest (OI) is simply the total number of futures contracts that are open. Because the futures market is a zero sum game (so to speak), if there’s someone long a contract then there must be another party taking the other side. Because Commercial Traders often are the ones taking the other side of Large and Small Trader positions, when their net position as a % of OI goes positive, it suggests there’s a lot of interest on the other side to be short. This often occurs after the market has gone down. What typically happens when everyone is bearish? The market proves them wrong and goes higher. So By looking at the total net position for the S&P 500, Dow Industrial, and Nasdaq futures, we can gauge the sentiment of the market. When Commercials % of OI is positive, markets have often done pretty well. In fact, since the Covid Crash Commercials have had a positive % of OI most of the time as stocks have climbed higher.
This is just a few examples of how COT data can be utilized. There’s many ways to slice and dice this valuable weekly report. I personally spend a great deal of time digging through it every week. Like all sentiment-type data, not every weekly is there actionable or useful updates but by tracking how traders are positioning themselves in various markets from corn, natural gas, British pound, S&P 500, platinum, or coffee, some good insight can be gained!
If this type of analysis interests you, I’d suggest checking out my weekly letter at Thrasher Analytics, where I share not only insights on the COT data but a whole lot more.