
Trending

Equity Index Sentiment
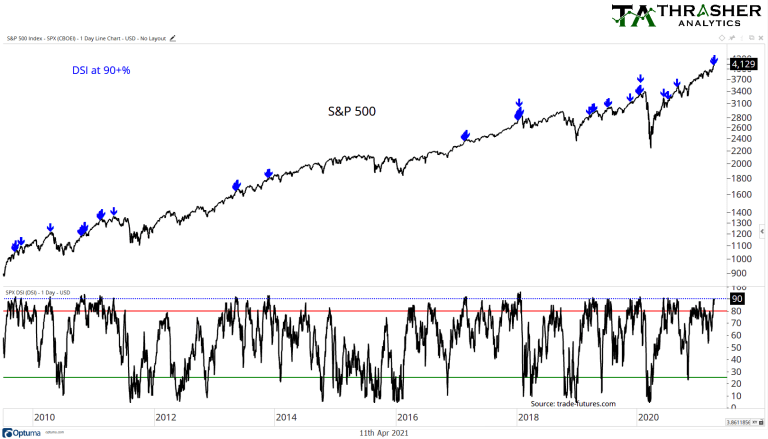
There are many surveys and data sets used to evaluate sentiment, from AAII, NAAIM, Investor Intelligence, Market Vane, ect. One of my favorites is, the Daily Sentiment Index, which measures the bullishness of retail investors in each futures contract. The methodology is propriety to trade-futures.com but it’s a set of data used by many hedge funds, institutional investors, and traders. Sentiment is one of the six inputs for my Thrasher Analytics Market Health Report, a tool used to unemotionally evaluate the market and something I share in my weekly letter.
Recently the sentiment data for equities has been rising and last week broke above 90% bullish for the S&P 500 and Nasdaq 100. This is the first time since the September ’20 high when sentiment was at least 90% bullish for the S&P 500, as shown by the blue arrows on the chart. Sentiment is stretched and it’s not just a short pop higher, as I’ll show on the next chart.
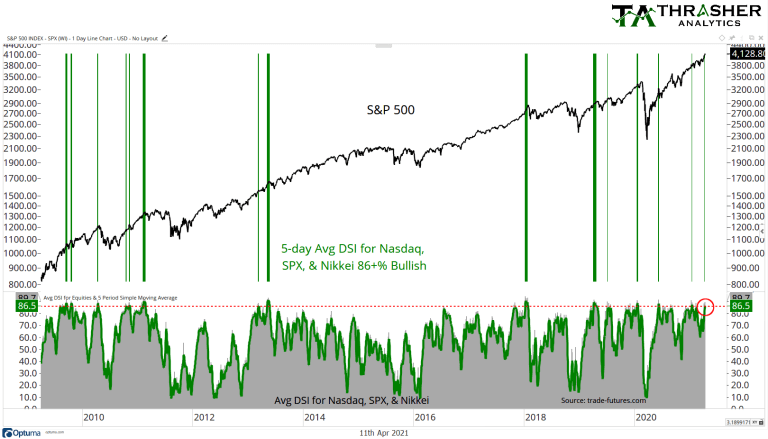
Below we have the 5-day average DSI % Bullish for the Nasdaq 100, S&P 500, and Nikkei indices. Currently the average is 86.5% and I’ve drawn green vertical lines when its risen over 86%. Each time sentiment for the this group of indices got frothy wasn’t always followed by an immediate move lower in price but we often saw less attractive price action follow, especially over the last couple of years.
Investor Equity Allocation
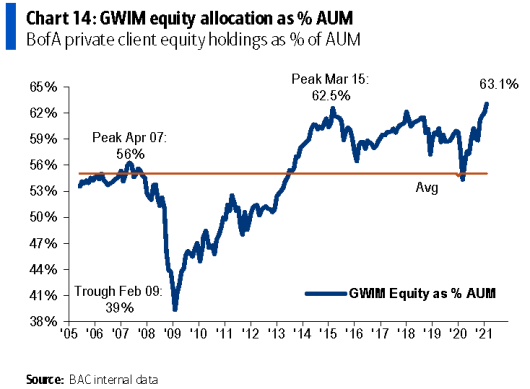
Is the rise in sentiment just due to small retail investors coming to the market? I’m not so sure. This chart is from Bank of America and shows the percentage of the Private Client portfolios invested in equities, which most recently hit a new high of 63.1%. Michael Hartnett, BofA’s Chief Investment Strategist noted equities saw an inflow of almost $16 billion last week and global equity funds saw a new record inflow in the first quarter. I believe BofA Private Client targets investors with a minimum of $3 million in liquid assets, so this isn’t simply retail traders investing their stimulus checks.
Sentiment vs. Breadth-Driven Declines
I’ve written in the past that I think there are two types of market corrections. One is led by sentiment and the other by breadth. Breadth-driven sentiment, like we saw in 2018 and to some regard, March 2020, are much larger drawdowns and can be more protracted in time compared to corrections led by frothy sentiment. Elevated Sentiment, like in the first quarter of 2018, are often quick and the decline less severe. When breadth data is strong, like I believe it is today, individual equities act as a supportive tailwind for the indices, helping dampen the damage from a short-term pullback. While a breadth-led decline sees individual stocks help add fuel to the fire of a move lower, making the decline more severe.
The froth being shown in sentiment today comes at a time when momentum is also fairly high on both the daily and weekly charts, this is another topic and set of charts I shared in April 11th Thrasher Analytics letter.
Demark
It’s also interesting to note its occurring as both the S&P 500 and Dow hit Tom Demark’s price projections. On his show, Mad Money, Jim Cramer discussed some of the tools and commentary from Tom Demark. Demark’s data sets a projected top in SPX at 4139, 11 points above where we closed Friday and 33,959 on the Dow, 159 points higher than Friday. It’s interesting to note the froth in sentiment is coming right as price approaches these Demark projection levels and Sequential 13 top indicator on both the SPX and Dow.
Breadth Still Remains Supportive
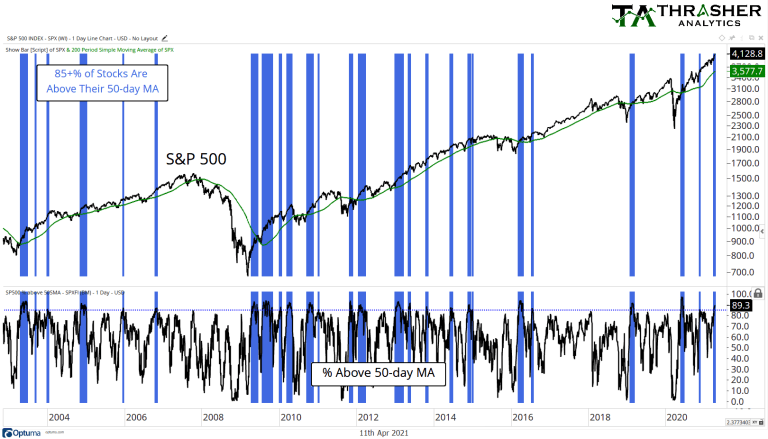
There’s a lot of different ways to evaluate market breadth but below I’m showing just one, the percentage of S&P 500 stocks above their respective 50-day MA. Currently, 89% of stocks are above this intermediate moving average, with each prior occurrence of 85+% marked by a light blue line. Notice the times not showing at least 85% of stocks above the 50-day? Major drawdowns. 2007, 2011, 2015, 2018, 2020 – each of the largest drawdowns in the last 13 years had much lower market participation. This doesn’t mean we didn’t see pullbacks when breadth was still strong, but just in 2010 did the SPX see a material break under the 200-day MA when stocks did pull back.
This suggests that if we do see the market begin to respond to the elevated sentiment, the strong breadth figures should help blunt the damage.
In summary
We have 90+% bullishness in the S&P 500 and Nasdaq, elevated momentum on several indicators as well as the SPX 39% above its 200-week moving average, the highest since Tech Bubble. It’s hard to argue that some degree of pullback in equities around this point would be unwelcomed. It’s completely normal to have counter-trends within a broad up trend, not every pullback must be a multi-year top or be followed by a devastating drawdown. The largest declines in equities often follow bearish divergences in momentum and breadth and currently we don’t have divergences in either as the Relative Strength Index has risen to a multi-month high and 93% of stocks are trading above their 200-day moving average, the highest reading since 2013.
Related: We May Be In A Bubble But It Really Doesn’t Matter
Disclaimer: Do not construe anything written in this post or this blog in its entirety as a recommendation, research, or an offer to buy or sell any securities. Everything in this post is meant for educational and entertainment purposes only. I or my affiliates may hold positions in securities mentioned in the blog. Please see my Disclosure page for full disclaimer. Connect with Andrew on Google+, Twitter, and StockTwits.