
Trending

Written by: Matt Lloyd | Advisor Asset Management
As we entered 2021, we put the pivot point of the economy and market returns squarely on inflation. An environment where inflation is elevated for a longer period dictates that changes to allocations are necessary. When the question is about concerns with inflation, there were two of the three answers that dominated the answers: “There is no inflation and we have heard this for 25 years with no elevated inflation occurring,” and “We are going to go back to hyperinflation of the 1970s and 1980s.” The least answered among most clients was that “We are in for elevated levels of inflation.” One can understand psychologically why the two polarizing answers dominates the debate; however, it quickly becomes apparent that most investors are not prepared for the more likely scenario based off recency and confirmation bias.
We will discuss as briefly as possible while touching on the more salient points of the inflationary cycle and the layers and sequencing that are at play.
The four layers of inflation are – and by no means every form – asset, input, wage and ultimately consumer pass through.
Asset inflation is by far the most prominently felt at this stage of the recovery and doesn’t need much belaboring at this point. As we look at elevated multiples and exuberant enthusiasm for equities, it is not a surprise that the cannibalizing of future growth in many sectors has confused many investors as to where we stand in the economic, credit and market cycles. Equity multiples and prices combined with historic low spreads on high yield debt and investment-grade credit would dictate we are in a late stage cycle. Earnings growth, however, points to early cycle metrics and the worst start to fixed income returns could lead one to believe we are in the mid stages. If we remove these metrics, the mere aspect of time (months after the worst of the recession) would warrant an early cycle. Lastly, some of the inflation metrics would dictate a later stage cycle. All this is to say that certain historical road maps are not as clean as Economic engineers would like. There is far more need for an artistic scrutiny than a scientific one, as much school yard as classroom if you will.
One important asset-price driver to consider is that the earnings growth on a global basis is running at one of tis strongest in the last 45 years. The MSCI earnings growth in 2021 is running at a rate only seen in 1979, 1988,1999, 2003, 2004 and 2010. While Wall Street is often run by “Buy on the rumor and sell on the news,” the returns during the above years and the year following don’t always hold true. While this is a measure of the MSCI World earnings year-over year-change, the S&P 500 returns of the six years listed above (removed this year since it is not complete) averaged 18.37% with the worst being 14.81% in 2010. The year following had a two-year average total return of 32.03% with the lowest two-year total return being 1999-2000 at 10.08%. When you compare it to the MSCI global ex U.S. you find similar returns, an average 20.88% and two-year total reruns was 31.27%. A high tide does lift all boats. I ran the S&P 500 as a measure to see how the U.S. benefitted or didn’t from a global growth environment and how domestic-listed companies performed in a competitive environment for investment dollars. In this case there wasn’t much difference, but that does give a current investor an opportunity to look at what areas have not performed as well as the U.S. counterpart and potentially details some deeper value and potential outperformance in the future.
As great as the asset returns have been across the globe, one need only look at the input impact over the last year. The price of lumber is up 367% over the last year and 520% from its low in April 1…no this is not a belated April fools’ joke. Copper is up 120% since its low on Mach 23, 2020 and iron ore is up 96% since its low on April 10, 2020.
This is not just impacting the metal or construction aspects of the economy. Corn is up 123%, wheat is up 54%, soybeans are up 96% and coffee is up over 50% from their lows last year. We continue to see upside to the gains in the agricultural side as we saw last summer, though it might be a bit more muted. There are some extenuating circumstances for this. By many forecasts, the heavy grain-growing region of China will continue to see flooding that impacted nearly a quarter of its crops and forced increased grain imports. China is still dealing with a swine flu that impacted their output in 2020 by over 3% from 2019 that saw a massive reduction in their herds by nearly 41%, according to Reuters compared to 2018. This caused the price of pork to double during 2019. This also caused massive amounts of needed imports of agricultural goods. With news recently of the bridge in Memphis that had a sheer break that caused barges to be halted and trucking halted from crossing this bridge, look for slight disruptions in even our domestic shipping and transportation to cause further food appreciation. This is also not to mention the severe shortage of truckers needed to handle the increased demand for domestic transportation.
Energy has also seen the impact of growing demand from the economic shutdown. While we recognize the negative price per barrel, the reality is that before that synthetic market issue, it was trading around $21 a barrel. This is still a 215% increase in price over the last 14 months. Just as we have recently seen, the Colonial pipeline ransom demand being paid in an accelerated attempt to recover from the crippling gasoline shortages in many areas along the East Coast, so too have we seen global shipping being problematic for transportation. Commodities, as measured by the Bloomberg Commodity Index, are up over 50% from its lows last year. Over the previous four decades the 17.84% year-to-date return in commodities would rank in the top six total returns (top 15% of all 40-year returns) since 1980.
Emphasizing commodities continues to be a secular long-term play from not only the demand increasing during a global economic recovery, but the massive underbuilding of base input supplies over the last decade. When the just in time (JIT) manufacturing strategy began in the 1960s in Japan and gained fame during the technology explosion in the 1990s, it was only a matter of time before the benefits would ultimately exhaust the base suppliers. So long as everyone along the chain of manufacturing has access to immediate supply of goods needed by manufactures and shipping and transportation is seamless and able to be expedited, then the efficiency gained can be have a multiplier effect throughout the whole process. In seeing the complexities and shortages of the semiconductor market and now that Vietnam has overtaken China as the largest exporter of furniture to the U.S. – where imports have risen over 100% in the last 13 months – just affirms the supply chains will shift where needed if reasonable to do so. We continue to see diversification in supply chains and contingency supply chains being a focus over the next decade. This can be inflationary as costs are increased to elevate the ability or offset production efficiency in other areas to offer a secondary plan.
Another way to look at the shifting winds in inflation is the import price year over year and how its net impact relative to consumer price inflation has shifted historically.
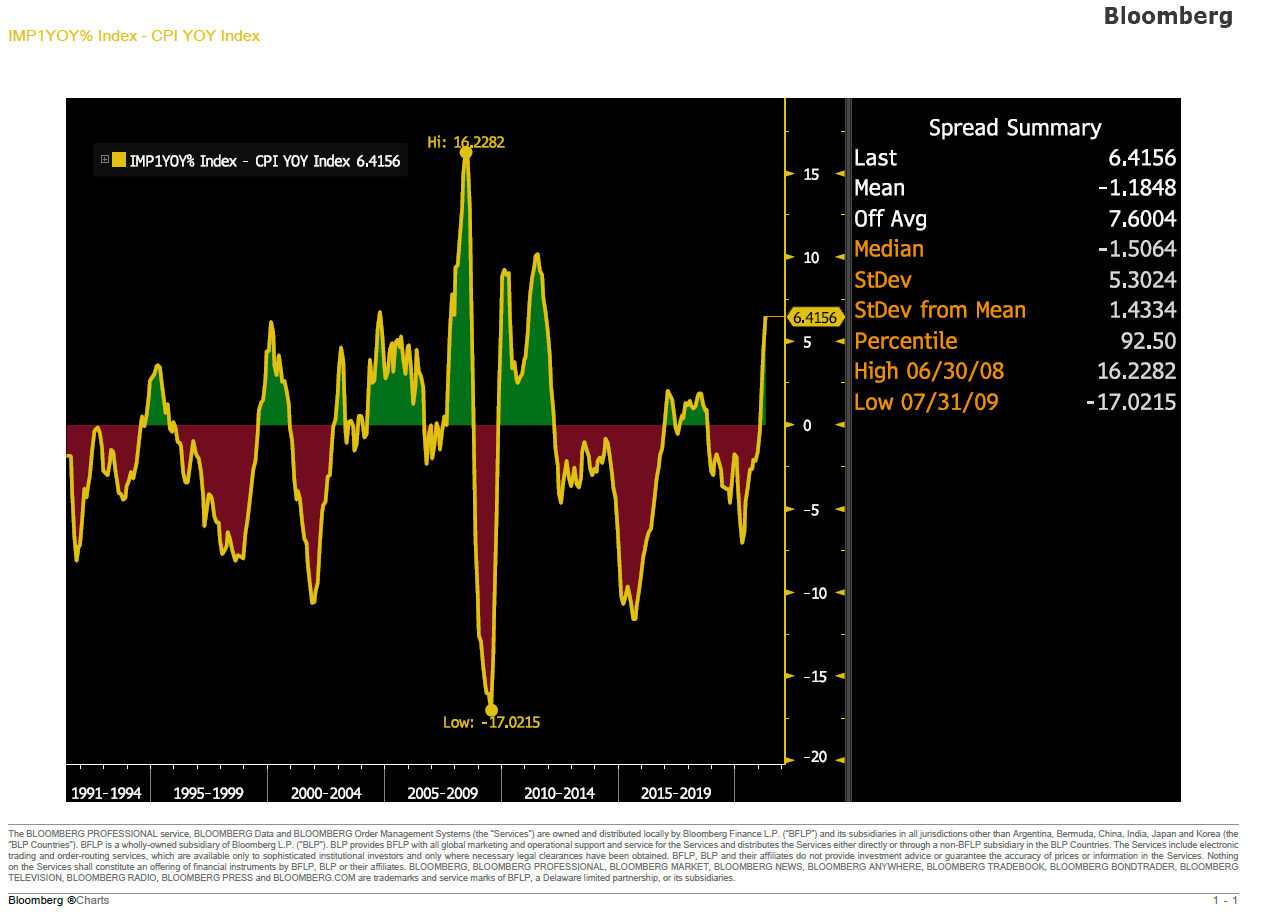
Past performance is not indicative of future results.
While it does show a historic visceral price move, the spread summary provided by Bloomberg over the last 30 years points to a current five sigma move from its median. As evidenced, the spread doesn’t stay elevated for long, however, it can mean that consumer price inflation moves higher to offset the current 10.6% import price year-over-year change. Note of caution, this is exacerbated by the significant drop on import prices this time last year, so we need to temper this reading a bit and suggests this spread could compress by both lower year-over-year metrics moving forward and elevated consumer price inflation.
The wage component of inflation is just now being felt when one looks at a myriad of metrics. Ultimately to have wage inflation, the old supply demand component needs to be in place. While we currently have one dynamic in place (jobs available), the amount of people not wanting to work is problematic and will therefore put upward pressure on wages to attract those who want to work. Obviously, the payment of income to those who were displaced due to the pandemic has wreaked massive shifts in the income seen for a large number of employable workers.
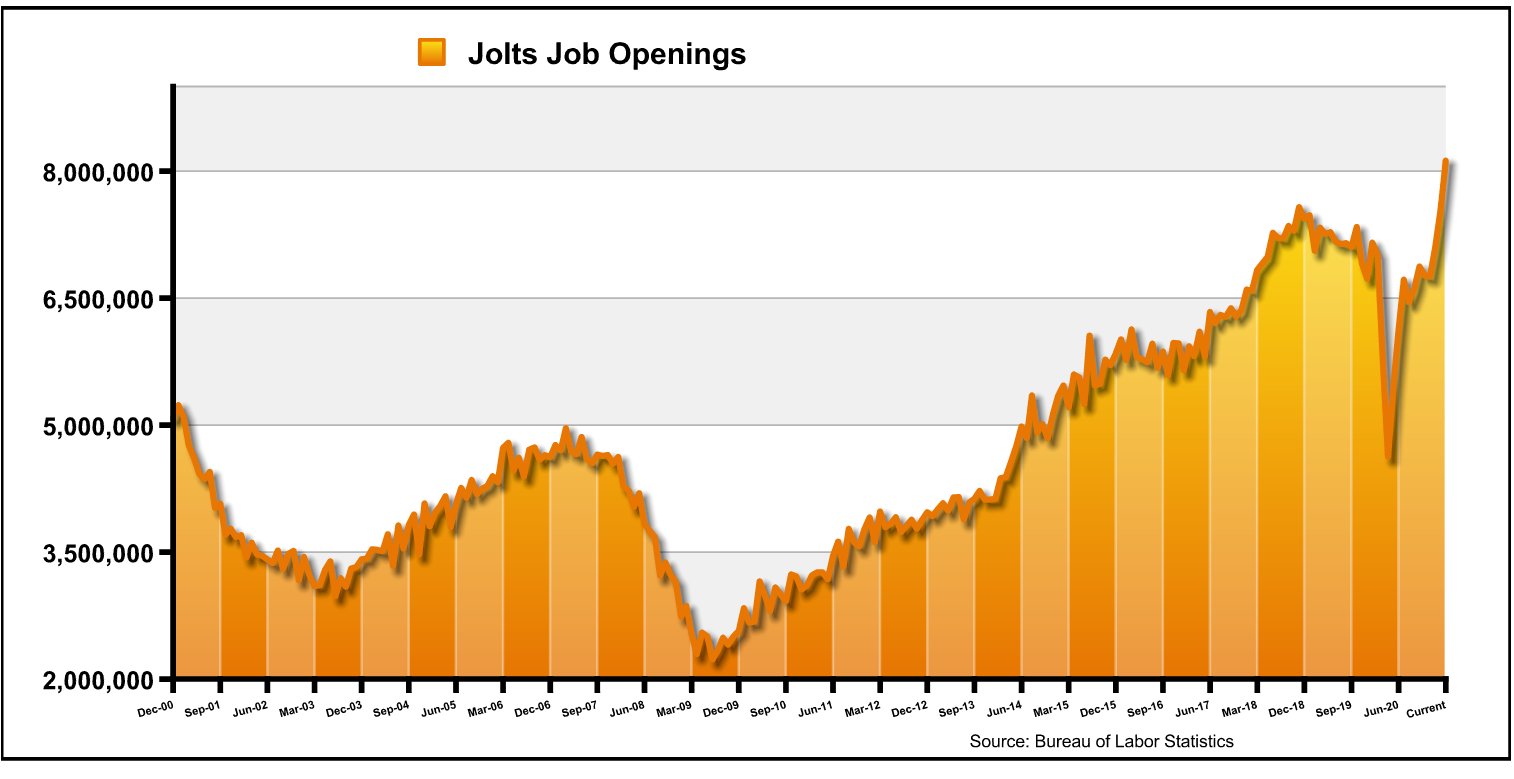
The amount of jobs listed by the BLS (Bureau of Labor Statistics) reveals why, anecdotally, we are seeing signing bonuses and even incentives from several states in an attempt to get idle workers to work again. The NFIB Small Business concern that inflation is the main worry just rose to its seven-year high, but it appears that more worrisome may be the employment component considering it is at all-time highs since measurements began over 45 years ago.
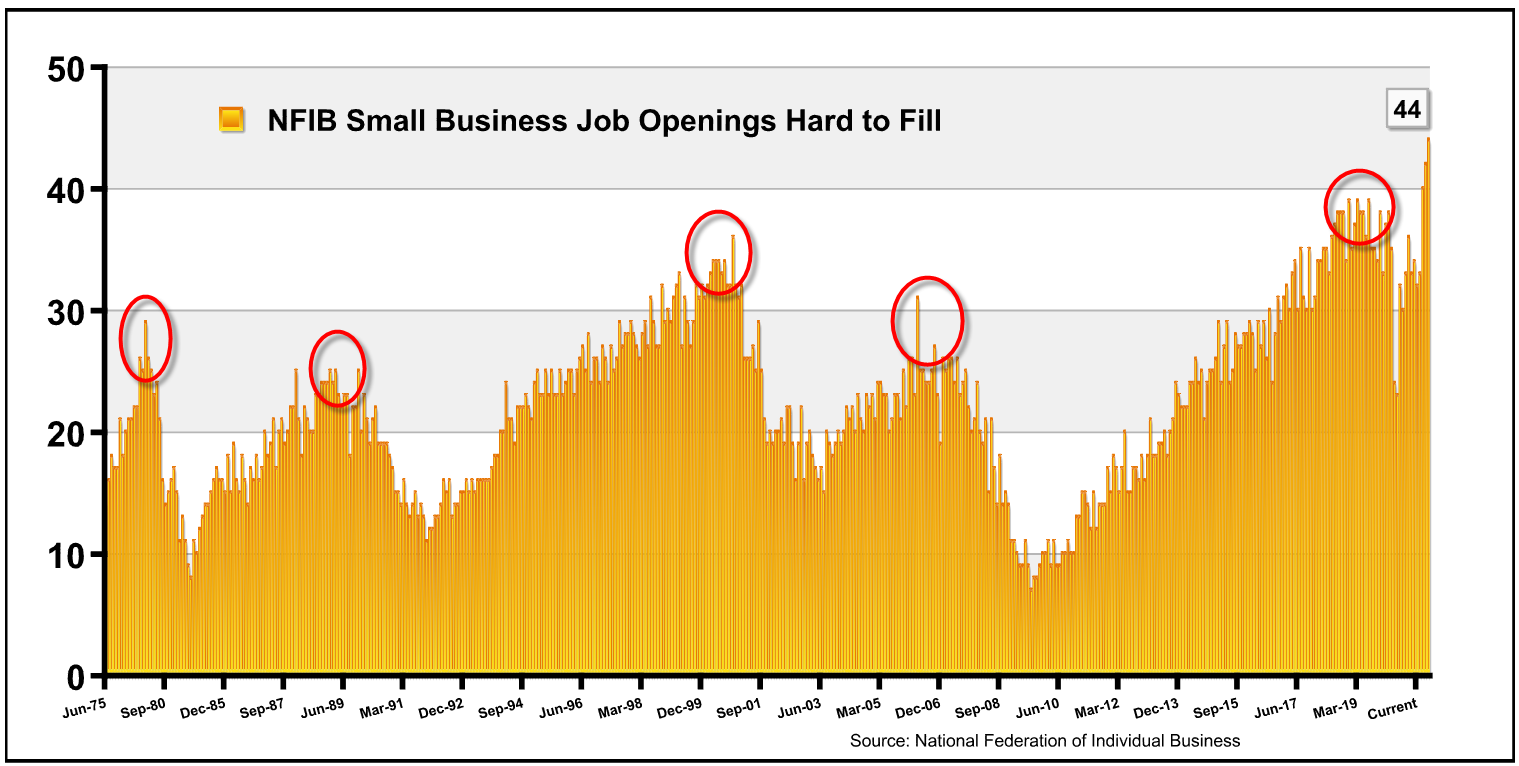
The red circles denote previous cycle highs when hiring was at its highest. Note that at nearly every point it was at or near an imminent recession. While we are now at all-time highs, a recession does not appear likely considering the recession was pandemic induced and was not driven by excess leverage or demand declining, as we traditionally see. This coupled with elevated equity prices could confuse the picture as to where we are at in the cycle.
Why the inflationary wage pressure will be accelerated in this recovery lies with the changes of the last recession when companies laid off employees relative to past recessions.
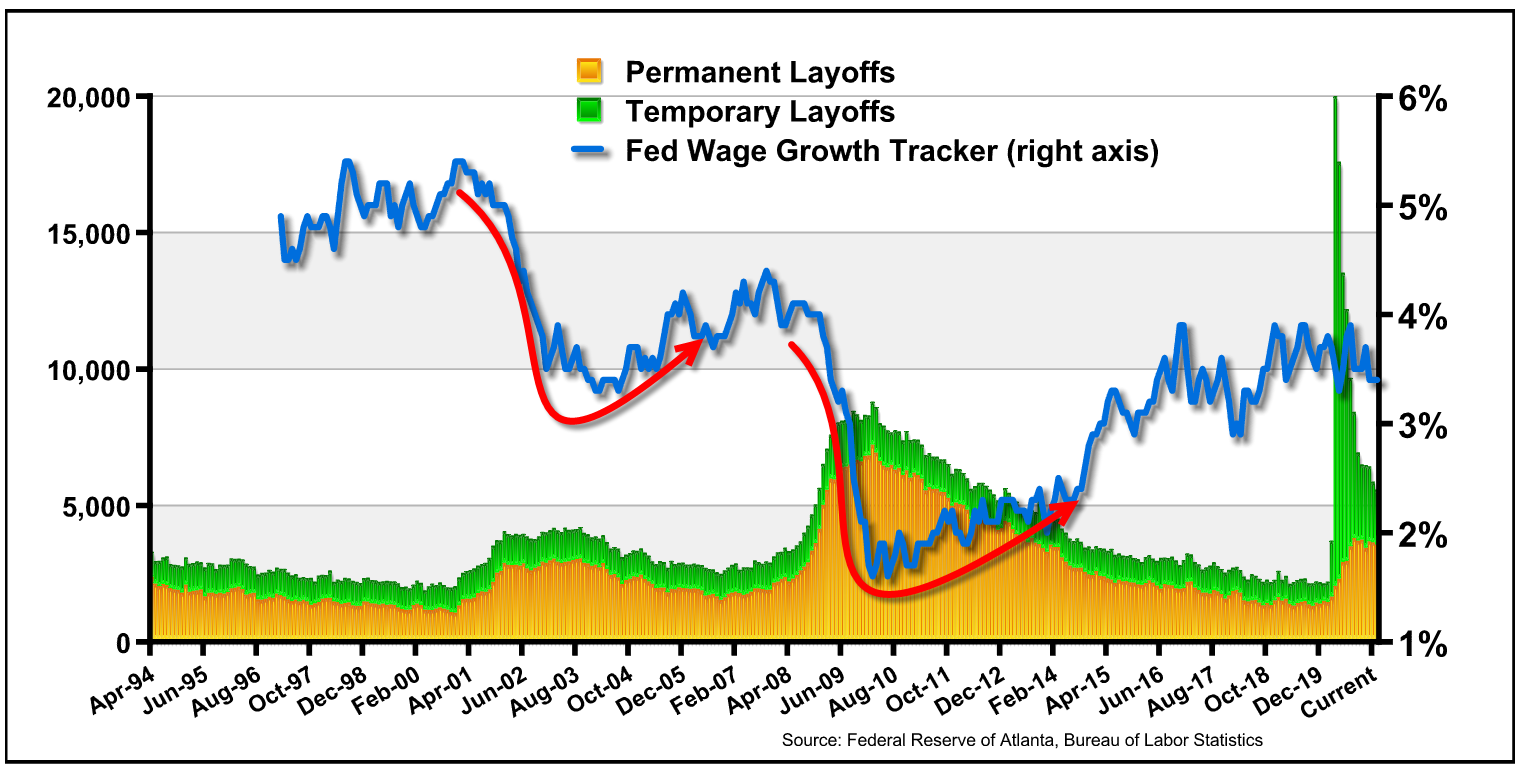
The first historic measure was the overwhelming temporary relative to permanent layoffs relative to the past two recessions. Obviously, this was done for multiple reasons relative to the fiscal stimulus that was provided and uncertainty about the amount of time until a recovery would set in. However, as pointed out by the red arrows, wages typically require several years after a recovery to begin increasing again. So, if an investor, business owner or policy expert were to use history as a guide, they may be in for a rude awakening on the pace of the inflationary cycle as it pertains to wages.
For one of the most detailed and comprehensive views of inflation across the economic spectrum, I found the following provided by Bloomberg’s Chief Economist Michael McDonough powered by Bloomberg BQNT as perhaps the best visual utilizing colors to denote what is heating up and what is cooling down. I strongly recommend following him for those who want a very detailed and data-driven analysis of all things relating to the economy.
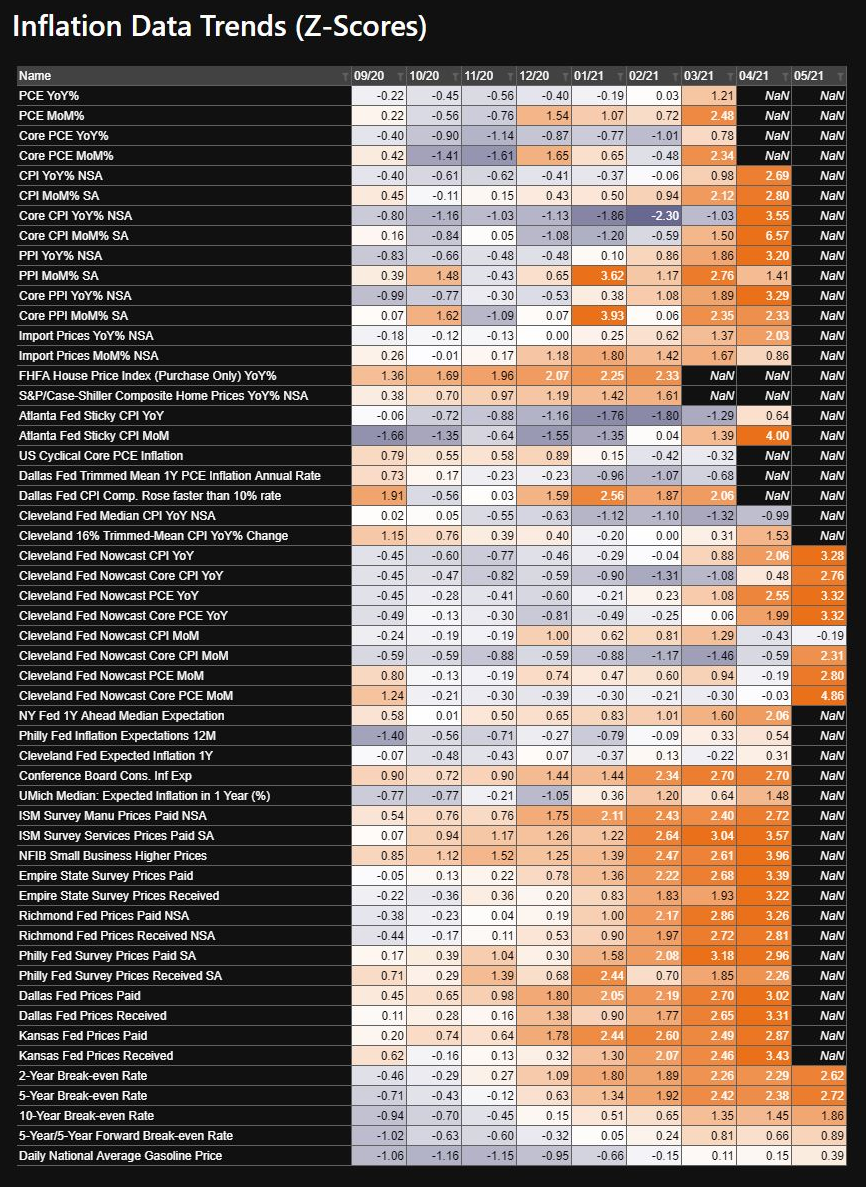
Source: Bloomberg’s Chief Economist Michael McDonough powered by Bloomberg BQNT | Past performance is not indicative of future results.
As the rising colors denote (orange), this is not just pockets of the economy that the consumer and businesses are feeling. The ultimate question as to whether this cycle turns into positive feedback loop of inflation will ultimately lie with whether the consumer can absorb the costs. Many of our contributors have detailed the ability for the consumer to absorb these costs more readily than at any time in recent memory.
I detailed this a few weeks ago in my commentary, AAM Viewpoints – Liquidity: Historic Gains Lead to Marginal Drains, where we have seen historic gains and how this could ultimately lead to marginal drains of the liquidity as the economy recovers. Scott Colyer and Jim Costas have written about this over the last few months and I would suggest reading up on those for a more comprehensive case as to why consumers will be able to absorb higher prices either directly or through product “shrink-flation.” Shrink-flation is where corporations reduce sizes of product that are delivered to consumers but maintain the prices to mask the higher costs. The short of it is with the immense amount of liquidity on the balance sheets of consumers as well as the historic net worth; incrementally rising inflation looks to be able to be passed through until it ultimately has taken too much of a bite. At that point, the governor in the system of inflation taking a psychological toll begins to transform into a traditional recession. In our opinion, we are not anywhere near that point, even if some asset prices may need to moderate their annualized returns to grow into their oversized clothes.