Written by: Meera Pandit
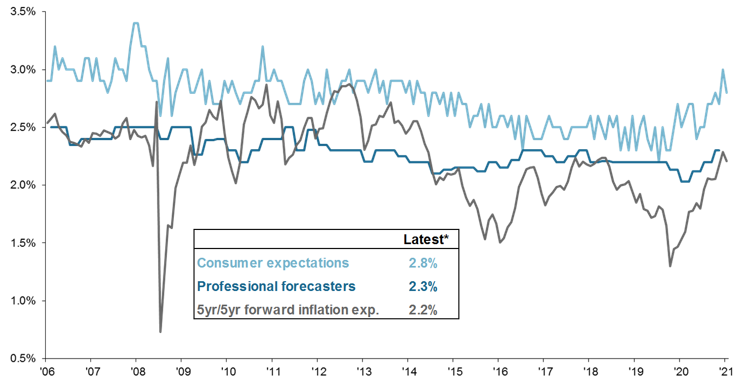
One of the most prevalent concerns among investors today is where inflation is heading next. The Fed watches inflation expectations closely, in part because expectations can be a self-fulfilling prophecy. The chart below from the third quarter Guide to the Markets shows three measures of inflation expectations over the next 10 years from consumers, economists, and the market. Each has its own nuances and implications, but together the mosaic of these measures can provide some insight into where inflation is going.
Consumer expectations, measured by the University of Michigan Survey of Consumers, tend to be the highest, currently at 2.8%. This reflects the pricing pressures consumers face in their daily lives, which may not be fully represented in the Consumer Price Index (CPI) due to its composition. For example, median existing home prices are up an astonishing 23.6% y/y and median new home prices are up 18.1% y/y, while the equivalent housing component in CPI is up just 2.1% y/y. That is because shelter prices are not measured by the costs of actual units sold, but rather what homeowners surveyed think their home would rent for if they rented it out (owners’ equivalent rent). Also, the component weights of CPI are revised every two years on a lag, and may not reflect real-time consumption patterns.
Economists, on the other hand, are familiar with the components and complexities of CPI, and can therefore account for them in their forecasts. Professional forecasters, measured by the Federal Reserve Bank of Philadelphia’s Survey of Professional Forecasters, anticipate 2.3% average CPI over the next 10 years. Forecasters’ expectations are remarkably stable compared to consumer or market expectations, as forecasting inflation is notorious challenging, and forecasters anchor expectations with monetary policy. The Fed has a 2% inflation target, although would tolerate an overshoot to balance muted inflation over the past several years.
The market, too, heeds monetary policy, but is subject to other market forces as well and is therefore the most volatile of the three. The 5-year, 5-year forward inflation expectation rate measures the expected inflation rate on average over the five-year period that begins five years from today. It has moved meaningfully higher over the past year to 2.2%, but is influenced by other technical factors within the TIPS and Treasuries markets, plus includes a risk premium, so it is not a pure inflation expectation.
There are many more measures of inflation expectations, but no single measure can truly forecast the future. Still, what is notable about these three indicators is that none exceed 3%. Although inflation may settle between 2-3% over the next several years rather than 2% or below we’ve seen over the past decade, consumers, economists, and the markets seem to agree that we’re not heading towards a sustained surge.
Inflation expectations, next 10 years
Percent, not seasonally adjusted

Related: What Are the Investment Implications of Rising Global Inflation?
Source: FactSet, Federal Reserve Bank of Philadelphia, Federal Reserve Bank of St. Louis, University of Michigan, J.P. Morgan Asset Management. *Data show the latest flash or final reading from the University of Michigan Survey of Consumers, latest daily 5yr/5yr forward inflation expectation rate, and the latest quarterly Survey of Professional Forecasters on a 1-month lag. The University of Michigan Survey of Consumer asks consumers, “By about what percent per year do you expect prices to go (up/down) on the average, during the next 5 to 10 years?”. The Survey of Professional Forecasters is conducted by the Federal Reserve Bank of Philadelphia and reflects the median estimate by professional forecasters of average CPI inflation over the next 10 years. The 5-year, 5-year forward inflation expectation rate measures the expected inflation rate (on average) over the five-year period that begins five years from today.
Guide to the Markets – U.S. Data are as of June 29, 2021.


