In keeping with last week’s theme, the market has mainly traded sideways this week. However, that correction I’ve been calling for weeks? We have potentially started.
While I don’t foresee a crash like we saw last March and feel that the wheels are in motion for a healthy 2021, I still maintain that some correction before the end of Q1 could happen.
Bank of America also echoed this statement and said last week that “We expect a buyable 5-10% Q1 correction as the big ‘unknowns’ coincide with exuberant positioning, record equity supply, and as good as it gets’ earnings revisions.”
Yes, the sentiment is still positive. That won’t change overnight. Vaccines seem more effective than we thought, especially against other variants of the virus. All that extra stimulus money and record low-interest rates could keep pushing stocks to more records and stimulate pent-up consumer spending. It’s not like the Fed is going to switch this policy up anytime soon, either.
They don’t call it a stimulus for nothing.
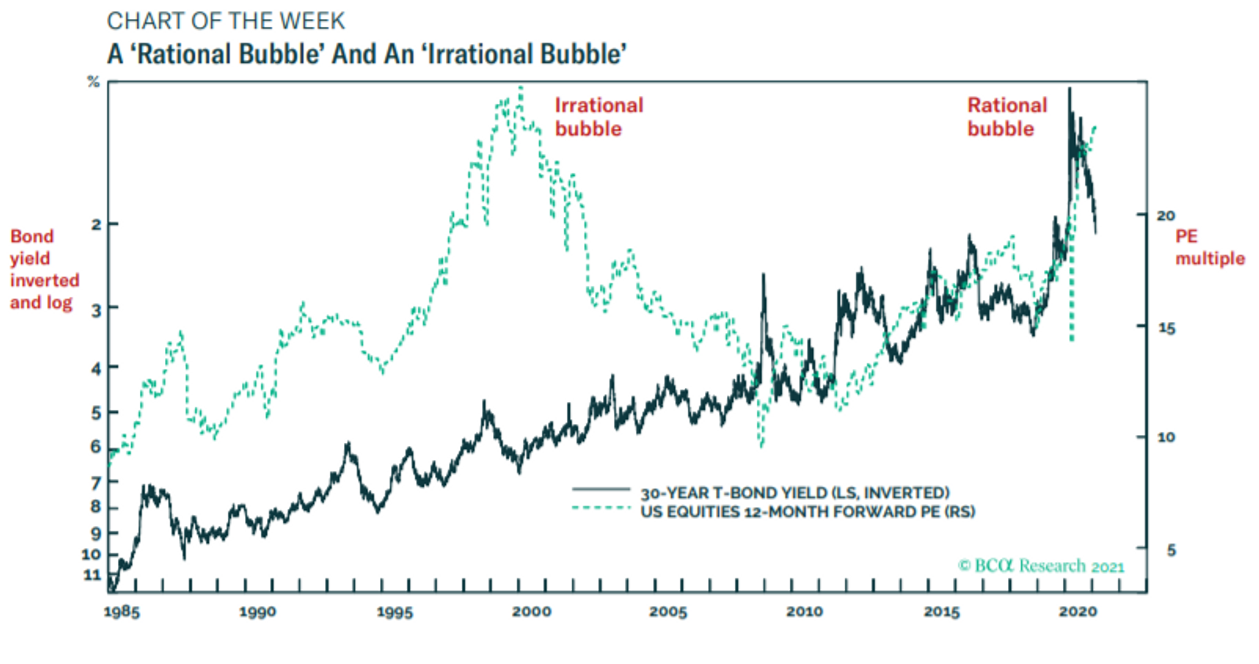
For weeks we’ve likely been in a rational bubble. Dhaval Joshi , the chief European investment strategist for BCA Research, has said that low bond yields meant the rally we’ve seen with stocks made sense.
“Rational, because the nosebleed valuations are justified by a fundamental driver. And not just any fundamental driver, but the most fundamental driver of all – the bond yield.”
Take a look at this chart comparing a “rational bubble” to an “irrational bubble.”

But now? Things have possibly changed. Complacency, valuations, surging bond yields, and inflation concern me.
They’re all connected. But look especially into the 10-year yield. It’s hovering around 1.30% for the first time in over a year.
Why is this concerning?
Rising interest rates=less attractive stocks.
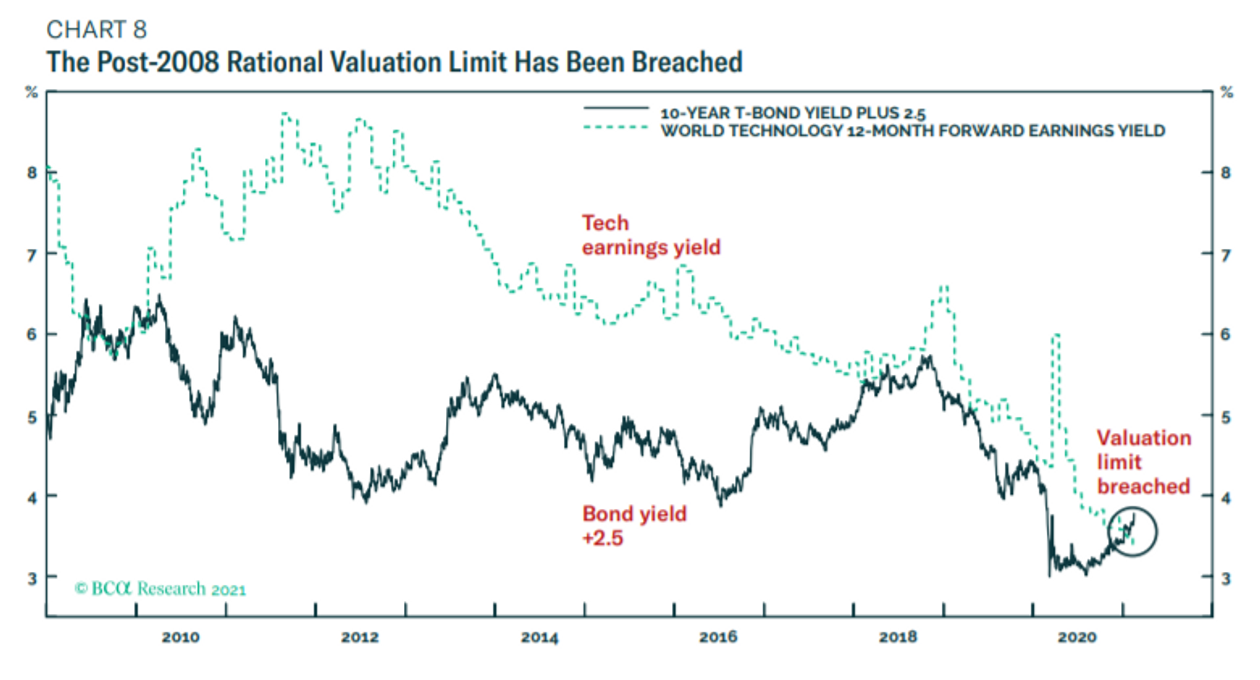
Look at this other chart. Forward P/E ratios are continuing to rise along with bond yields. In high-growth sectors, such as tech, this is especially concerning. The chart shows, in fact, that tech earnings yields have now been surpassed by the bond yield plus a fixed amount.

The only three ways this can be resolved are for stock prices to decline, bond yields to fall, or earnings to rise and improve stock valuations. Considering earnings season is over, only options 1 or 2 seem feasible in the near-term.
You combine this info with the Buffet Indicator (Total US stock market valuation/GDP), and you have a market that could be 228% overvalued.
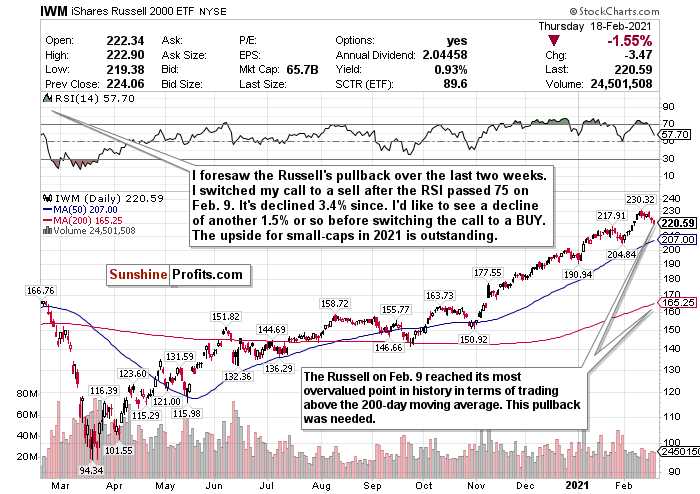
I’ve already correctly called the Russell 2000’s pullback after how much it’s overheated. Since February 9th, when I switched the call to a sell, it’s declined roughly 3.40%.
More could follow.
Look. Corrections are healthy and normal market behavior, and we are long overdue for one. Only twice in the last 38 years have we had years WITHOUT a correction (1995 and 2017), and we haven’t seen one in a year.
A correction could also be an excellent buying opportunity for what could be a great second half of the year.
My goal for these updates is to educate you, give you ideas, and help you manage money like I did when I was pressing the buy and sell buttons for $600+ million in assets. I left that career to pursue one to help people who needed help instead of the ultra-high net worth.
With that said, to sum it up:
While there is long-term optimism, there are short-term concerns. A short-term correction between now and the end of Q1 2021 is possible. I don’t think that a decline above ~20%, leading to a bear market, will happen.
Hopefully, you find my insights enlightening. I welcome your thoughts and questions and wish you the best of luck.
A Needed Cool Down for the Russell 2000

Figure 1- iShares Russell 2000 ETF (IWM)
Since February 9, the Russell 2000 small-cap index has lagged behind the other indices after significantly overheating. I switched my call to a SELL then, and it promptly declined by 3.40%.
I do love small-caps for 2021, though, and I really like this decline. If it declines about another 1.50%, I’d feel more confident switching the call to a BUY.
As tracked by the iShares Russell 2000 ETF (IWM) , small-cap stocks have been on a rampage since November.
Since the market’s close on October 30, the IWM has gained nearly 44.5% and more than doubled ETFs’ returns tracking the larger indices. If you thought that the Nasdaq was red hot and frothy, you have no idea about the Russell 2000.
Not to mention, year-to-date, it’s already up a staggering 14%.
Judging from these types of returns, the IWM’s decline since February 9 is hardly shocking. But for me, it’s still not enough, outside of switching the call to a HOLD.
It pains me not to recommend you to BUY the Russell just yet. I love this index’s outlook for 2021. Aggressive stimulus, friendly policies, and a reopening world could bode well for small-caps. Consumer spending, especially for small-caps, could be very pent-up as well.
But we need to just hold on and wait for it to cool down just a little bit more for a better entry point.
HOLD. If and when there is a deeper pullback, BUY for the long-term recovery.
For more of my thoughts on the market, such as the streaky S&P, inflation, and emerging market opportunities, sign up for my premium analysis today.
Related: A Sleepy Week for the Indices?
The views and opinions expressed in this article are those of the contributor, and do not represent the views of IRIS Media Works and Advisorpedia. Readers should not consider statements made by the contributor as formal recommendations and should consult their financial advisor before making any investment decisions. To read our full disclosure, please click here.


