For once, we have a week in 2021 where the market really didn't move all that much.
Except for weed stocks that whipsawed GameStock-like and Bitcoin and Dogecoin making waves thanks to Lord Elon, it's really been kind of a boring week for the major indices.
The S&P and Nasdaq closed at another record high Thursday (Feb. 11), while the Dow barely retreated from its own record high. The red-hot Russell has lagged this week.
However, it’s all relative. No index has moved upwards or downwards more than about 0.30% week-to-date.
It’s about time we had a week of relative quiet in the market.
The sentiment is indeed still rosy right now. The economic recovery appears to be gaining steam, and the Q1 GDP decline everyone predicted might not be as sharp as we anticipated. We could also be days away from trillions of dollars of much-needed stimulus getting pumped into the economy.
Earnings continue to impress, too, and are on pace to rise by over 20% in 2021. Since 1980, only 12 years have earnings increased by 15% or more. Except for 2018, the market gained an average of 12% in all of those years.
We could also days away from FDA approval of a one-dose vaccine from Johnson and Johnson (JNJ).
The COVID numbers and vaccine trend could truly turn the tide of things. More people in the U.S. have now been vaccinated than total cases, and the week kicked off (Feb. 8) with vaccine doses outnumbering new cases 10-1. Dr. Fauci also claims that vaccines could be available to the general public by April.
But we're not out of the woods yet. Sure this week has been calm.
But it’s almost been “too calm.”
I still worry about complacency, valuations, and the return of inflation.
“You wouldn’t know it from the sedate action in the averages,” but Wall Street is on “a highway to the danger zone,” CNBC ’s Jim Cramer said.
“In a frothy market, stocks will have enormous rallies that are totally disconnected from the underlying fundamentals.”
He’s not wrong.
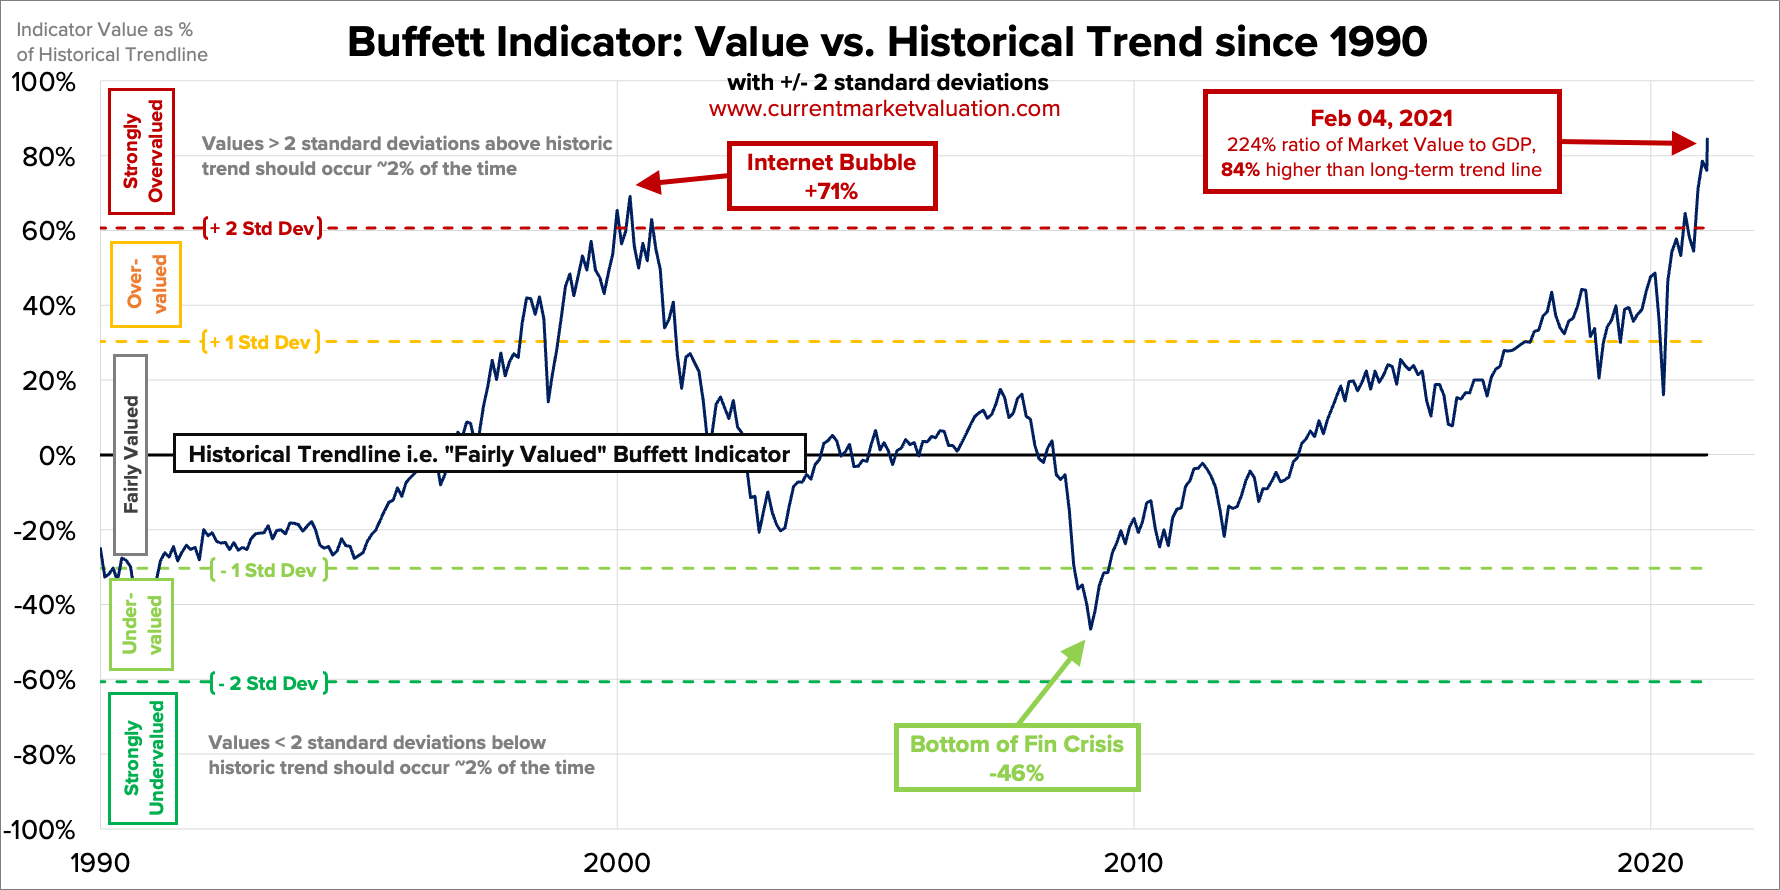
Look at the Buffett Indicator as of February 4. Where I track this indicator usually updates once a week and shows the total U.S. stock market valuation to the GDP.

If you take the US stock market cap of $48.7 trillion and the estimated GDP of $21.7 trillion, we're nearly 224% overvalued and 84% above the historical average. This ratio has not been at a level like this since the dotcom bubble.
Worse? This chart was dated February 4. The market’s only risen since then.
This is what I mean by don’t be fooled by the relative calm of this week.
The S&P 500’s forward 12-month P/E ratio is also well above its 10-year average of 15.8. The Russell 2000 is also back at a historic high above its 200-day moving average. Tech stock valuations are again approaching dotcom bust levels.
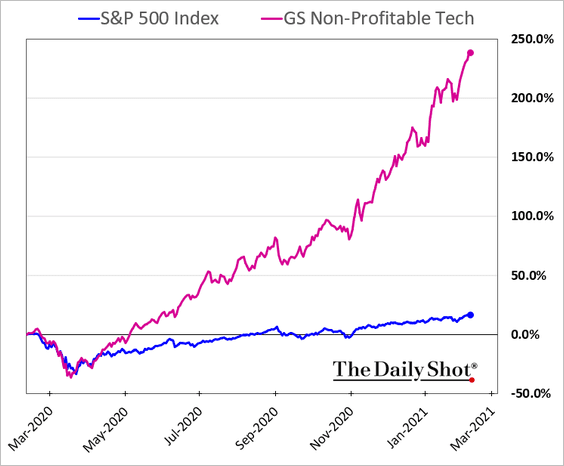
Still not sold? Look at Goldman’s non-profitable tech index. It’s approaching an absurd 250% year-over-year performance.

Bank of America also believes that a market correction could be on the horizon due to signs of overheating.
While I don’t foresee a crash like we saw last March, I still maintain that some correction before the end of Q1 could happen.
Corrections are healthy and normal market behavior, and we are long overdue for one. They are also way more common than most realize. Only twice in the last 38 years have we had years WITHOUT a correction (1995 and 2017).
A correction could also be an excellent buying opportunity for what could be a great second half of the year.
Bank of America also echoed this statement and said that “We expect a buyable 5-10% Q1 correction as the big ‘unknowns’ coincide with exuberant positioning, record equity supply, and ‘as good as it gets’ earnings revisions.”
The key word here- buyable.
My goal for these updates is to educate you, give you ideas, and help you manage money like I did when I was pressing the buy and sell buttons for $600+ million in assets. I left that career to pursue one where I could help people who needed help, instead of the ultra-high net worth.
With that said, to sum it up:
While there is long-term optimism, there are short-term concerns. A short-term correction between now and the end of Q1 2021 is possible. I don't think that a decline above ~20%, leading to a bear market will happen.
Hopefully, you find my insights enlightening. I welcome your thoughts and questions and wish you the best of luck.
The Streaky S&P Is Back at a Record

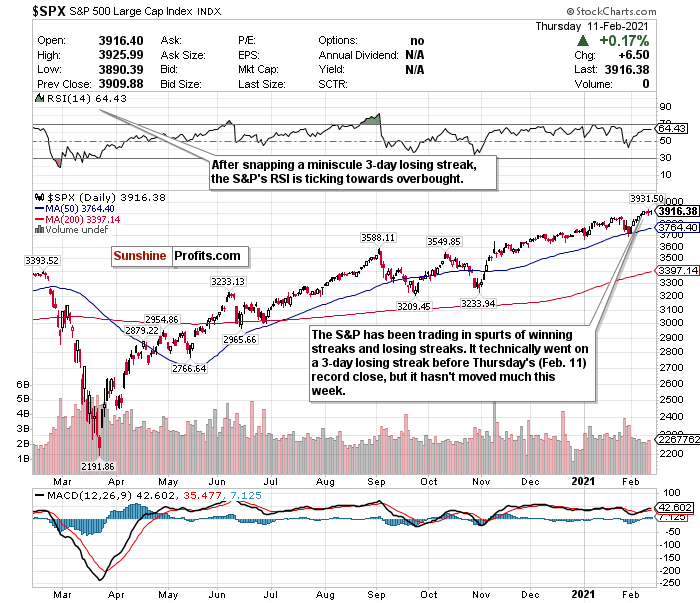
Figure 1- S&P 500 Large Cap Index $SPX
The S&P continues to trade as a streaky index. It seemingly rips off multiple-day winning streaks or losing streaks weekly.
After the S&P 500 ripped off a streak of gains in 6 of 7 days, it promptly went on a 3-day losing streak, followed by another record close.
I would hardly call that a 3-day losing streak, though. I’d even say it was a boring week for the S&P 500 with muted moves.
The outlook is healthy, though, especially when you consider earnings. More than 80% of S&P stocks that have reported earnings thus far have beaten estimates.
What could be on tap for next week? Who even knows anymore. But if earnings keep on outperforming, and the sentiment remains stable, it could be another strong week.
The S&P’s RSI is ticking up towards overbought. However, because it’s still below 70, and because of the streaky manner in which the index has traded, it remains a HOLD.
A short-term correction could inevitably occur by the end of Q1 2021, but for now, I am sticking with the S&P as a HOLD.
For an ETF that attempts to directly correlate with the performance of the S&P, the SPDR S&P ETF (SPY) is a good option.
For more of my thoughts on the market, such as red-hot small-caps and emerging market opportunities, sign up for my premium analysis today.
Related: Fears of a Stock Market Bubble Are Genuine
The views and opinions expressed in this article are those of the contributor, and do not represent the views of IRIS Media Works and Advisorpedia. Readers should not consider statements made by the contributor as formal recommendations and should consult their financial advisor before making any investment decisions. To read our full disclosure, please click here.


