Over the long-term, investment results match long-term research. In the short run, however, results are super noisy and can vary. Ignore the noise and your long-term outcomes are good; react to the noise and you likely end up with the opposite.
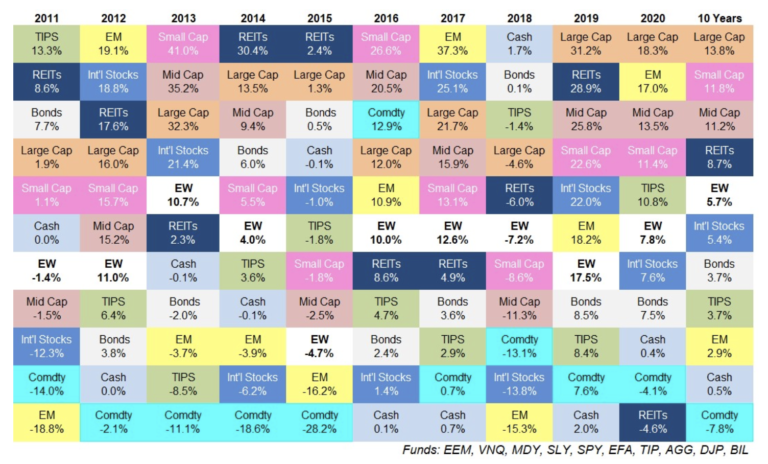
Everyone is familiar with the “quilt chart” that depicts investment asset categories and the randomness of their performance each year from highest on the top to lowest on the bottom.

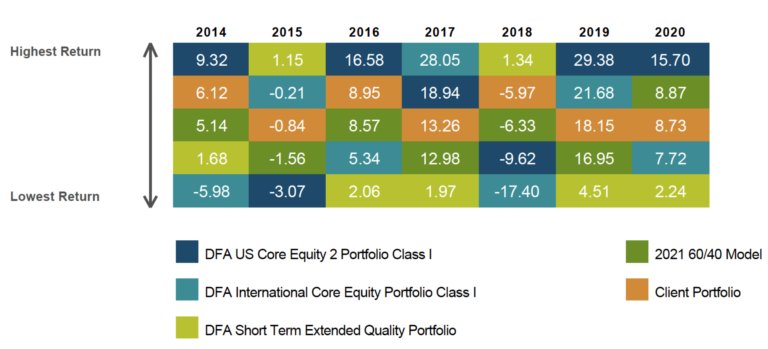
A few years ago, we decided to shrink the “quilt chart” down to include just a few categories so that clients could interpret the data more easily.

Here’s the interesting part. Since we started using this chart in planning review meetings, not a single client has a single year where their portfolio had the highest or lowest returns.
We didn’t know with certainty this would be the case when we started this exercise but the ensuing result has amplified our belief in the value of diversification and research.
Over time, actual observed returns tend to line up fairly close to the expectations, (60/40 in this example), with differences mostly explainable by flows in and out of the portfolio.
Leaning into research to lessen anxiety
Applying financial science to investing lowers the anxiety associated with investing and opens up the framework for a better overall experience. Behavioral science tells us that the more we can dis-engage emotions from investing, the higher the returns are likely to be.
There will always be short-term winners. Sometimes we equate this with investing skill instead of luck.
The odds of tossing a coin and coming up with 10 heads in a row are around 1 in 1000. Given the thousands of stocks, mutual funds, and ETF’s in the market, there will likely be times where some outperform in the short-term. The ability to persist in this performance for the long-term, however, is rare.
You don’t have to outguess the market in order to be a good investor, but you do need to pay attention to the research and science. Start there.
Related: What You Believe and What You Know


