
Trending


"Yes, Virginia. There is a stock market bubble.“
In 1897, an 8-year girl named Virginia O’Hanlon sent a letter to the New York Sun questioning Santa Claus’s existence. Why? Because her friends had all told her that Santa Claus didn’t exist.
As we enter 2021, there are two myths told to investors to support the bull market narrative. The first, as we debunked recently, is that low-interest rates justify high valuations. The second is that since valuations are not as high as the “dot.com” crisis, there is no “stock market bubble.”
Both of these views are rationalizations by investors to continue overpaying for assets during a liquidity-fueled bull market. Unfortunately, as investors pile further into risk assets, driven by herd mentality and confirmation bias, the eventual outcomes have been less than kind.
“My confidence is rising quite rapidly that this is, in fact, becoming the fourth ‘real McCoy’ bubble of my investment career. The great bubbles can go on a long time and inflict a lot of pain, but at least I think we know now that we’re in one.” – Jeremy Grantham
That was a comment he made during a CNBC interview when discussing the market’s rapid rise following the March correction.
What Is A Bubble?
What is the definition of a bubble? According to Investopedia:
“A bubble is a market cycle that is characterized by the rapid escalation of market value, particularly in the price of assets. Typically, what creates a bubble is a surge in asset prices driven by exuberant market behavior. During a bubble, assets typically trade at a price, or within a price range, that greatly exceeds the asset’s intrinsic value (the price does not align with the fundamentals of the asset).“
While this definition is suitable for our discussion, there are three components of a “bubble.” The first two, price and valuation, are often discussed and readily dismissed during the inflation phase.
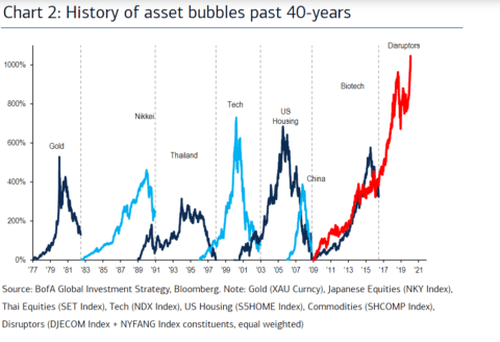
Jeremy Grantham recently produced the following chart of 40-years of price bubbles in the markets. During the inflation phase, each was readily dismissed under the guise “this time is different.”
Valuations are also quickly dismissed with “new metrics,” like Shiller’s recent endeavor into “earnings yield.”
But what we do know is that valuations have a massive impact on expected returns.
Here is “the thing.”
“Market bubbles have NOTHING to do with price or valuations.”
The Rudimentary Theory Of Bubbles
Let me explain.
If market bubbles are about “psychology,” as represented by investors’ herding behavior, then price and valuations are reflections of that psychology.
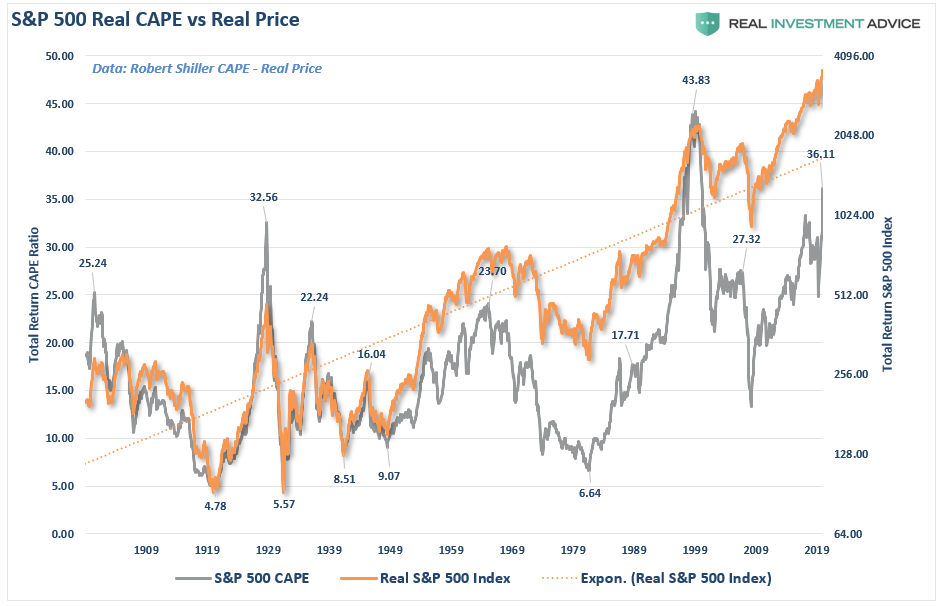
In other words, bubbles can exist even at times when valuations and fundamentals might argue otherwise. Let me show you an elementary example of what I mean. The chart below is the long-term valuation of the S&P 500 going back to 1871.

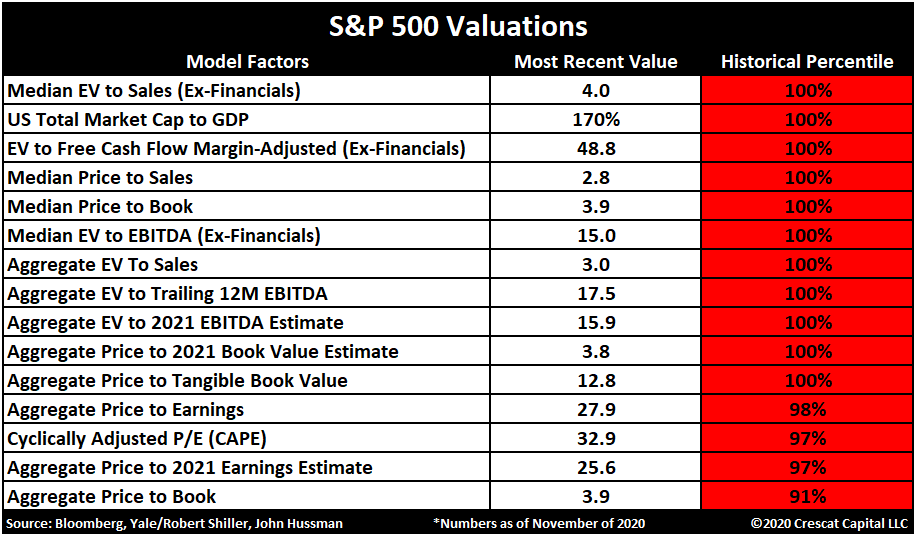
Notice that except for only 1929, 2000, and 2007, every other major market crash occurred with valuations at levels LOWER than they are currently. As shown in the table below from Tavi Costa at Crescat Capital, markets are currently trading in the top decile of valuations on many levels.
Secondly, all market crashes, which resulted from the preceding bubble, have been the result of things unrelated to valuation levels. Those catalysts have ranged from liquidity issues to government actions, monetary policy mistakes, recessions, or inflationary spikes. Those events were the catalyst, or trigger, that started the “reversion in sentiment” by investors.
Bubbles Are About Psychology
We previously touched on George Soros’ theory on bubbles.
“Financial markets, far from accurately reflecting all the available knowledge, always provide a distorted view of reality. The degree of distortion may vary from time to time. Sometimes it’s relatively insignificant. At other times, it is quite pronounced. When there is a significant divergence between market prices and the underlying reality, the markets are far from equilibrium conditions.
Every bubble has two components:
- An underlying trend that prevails in reality, and;
- A misconception relating to that trend.
When positive feedback develops between the trend and the misconception, such sets a boom-bust process into motion. The process is liable to be tested by negative feedback along the way, and if it is strong enough to survive these tests, will reinforce both the trend and the misconception. Eventually, market expectations become so far removed from reality that it forces people to recognize that a misconception is involved. A twilight period ensues during which doubts grow, and more people lose faith, but the inertia sustains the prevailing trend.
As Chuck Prince, former head of Citigroup, said, ‘As long as the music is playing, you’ve got to get up and dance. We are still dancing.’ Eventually, we reach a tipping point as the trend reverses; it then becomes self-reinforcing in the opposite direction.”
Typically bubbles have an asymmetric shape. The boom is long and slow to start. It accelerates gradually, then flattens out again during the twilight period. The bust is short and steep because it involves the forced liquidation of unsound positions.
Asymmetry
The chart below is an example of asymmetric bubbles.
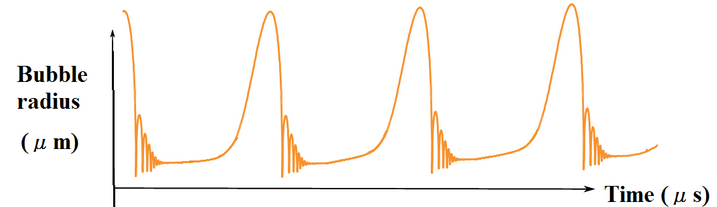
The bubble pattern is interesting because it changes the argument from a fundamental view to a technical viewpoint. Prices reflect the market’s psychology, which can create a feedback loop between the markets and fundamentals.
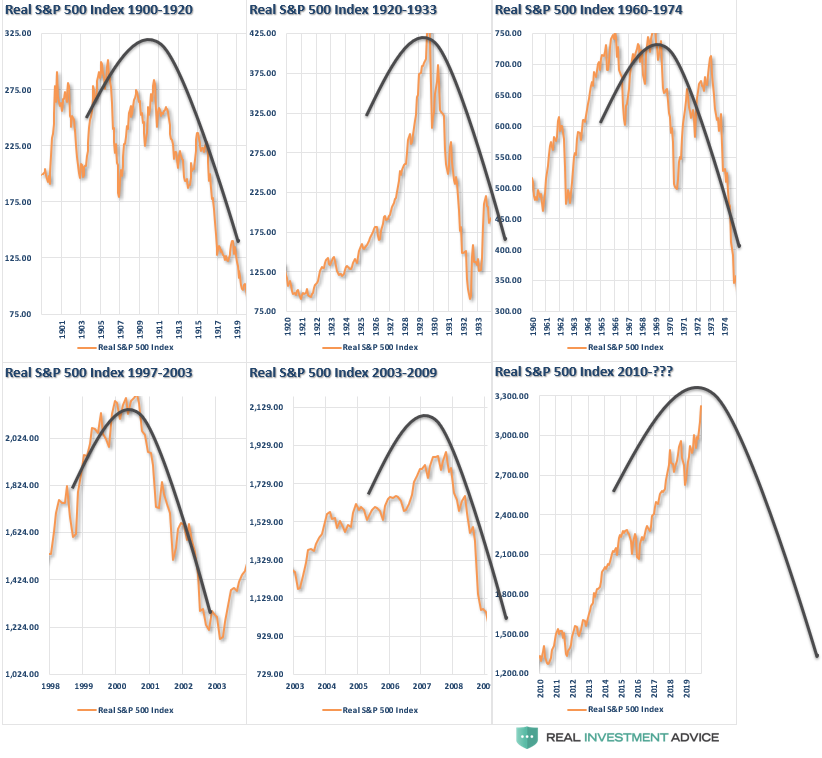
We see the asymmetric bubble pattern at every bull market peak in history.
The chart below utilizes Dr. Robert Shiller’s stock market data going back to 1900 on an inflation-adjusted basis with an overlay of the asymmetrical bubble shape.
As Soro’s went on to state:
“Financial markets do not play a purely passive role; they can also affect the so-called fundamentals they are supposed to reflect. These two functions, that financial markets perform, work in opposite directions.
- In the passive or cognitive function, the fundamentals are supposed to determine market prices.
- In the active or manipulative function market, prices find ways of influencing the fundamentals.
When both functions operate at the same time, they interfere with each other. The supposedly independent variable of one function is the other’s dependent variable, so neither function has a truly independent variable. As a result, neither market prices nor the underlying reality is fully determined. Both suffer from an element of uncertainty that cannot be quantified.”
There is a strong belief that the financial markets are not in a bubble. However, those beliefs use flawed comparisons to past market bubbles.
It is likely in a world where there is “no fear” of a market correction, an overwhelming sense of “urgency” to be invested, and a continual drone of “bullish chatter,” the markets are primed for the unexpected, unanticipated, and inevitable event.
In other words, the markets are in a bubble.
Evidence Of A Bubble
One does not have to dig too deeply to find evidence of the “psychology” driving the current stock market bubble.
Speak with almost any retail investor, and you will hear a common refrain from “the Fed won’t like markets decline” to common justification catch-phrases like the “Fear Of Missing Out (F.O.M.O)” or “There Is No Alternative (T.I.N.A.)”
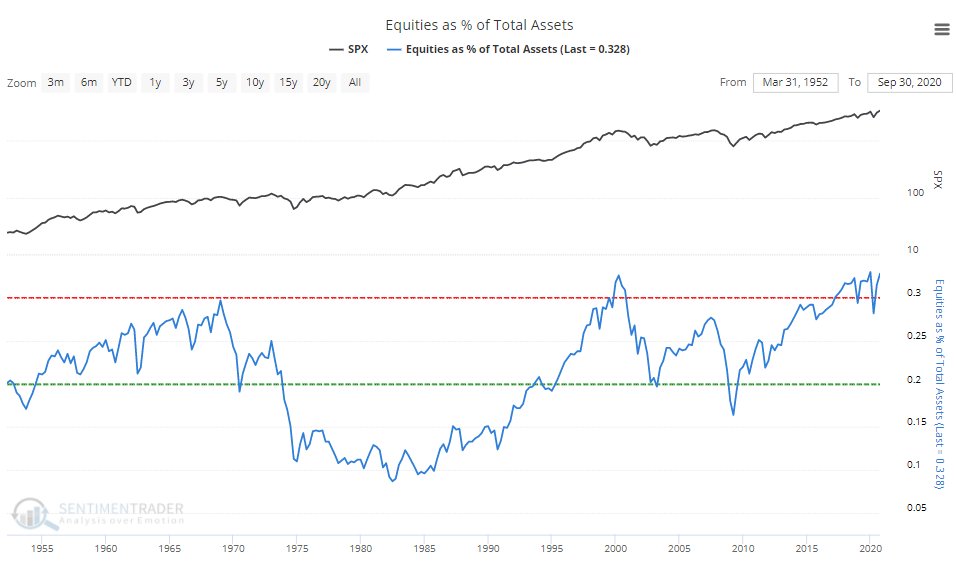
There is also plenty of anecdotal evidence of a market bubble in investor’s actions. Investors are currently exhibiting all of the behaviors associated with previous stock market bubbles, from aggressive equity allocations to risk leverage.
Currently, investors are holding nearly the highest levels of equities on record.
At the same time, they are leveraging their investment risk by carrying the highest levels of “call options” in history.
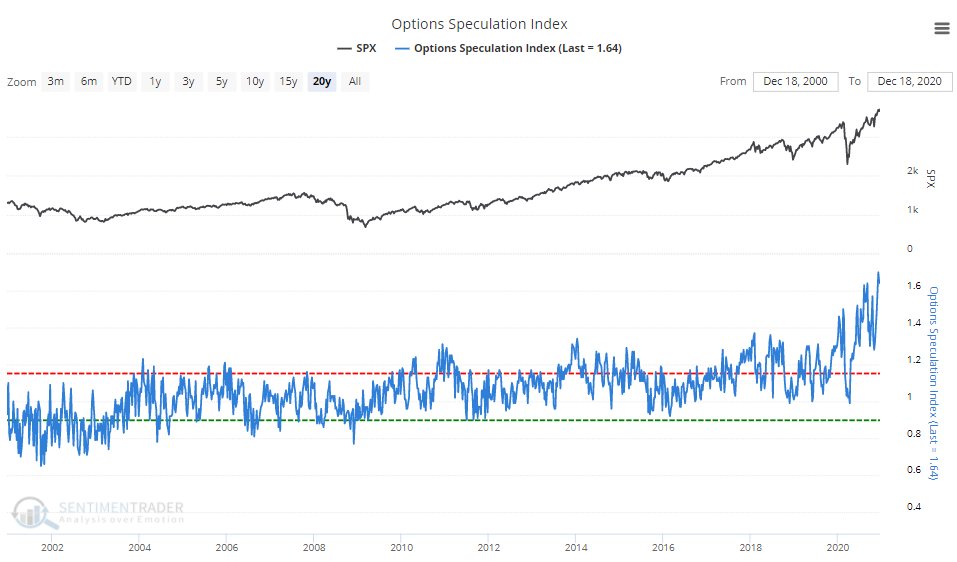
Of course, they are doing this because they are too “confident” the market will not be allowed to correct.
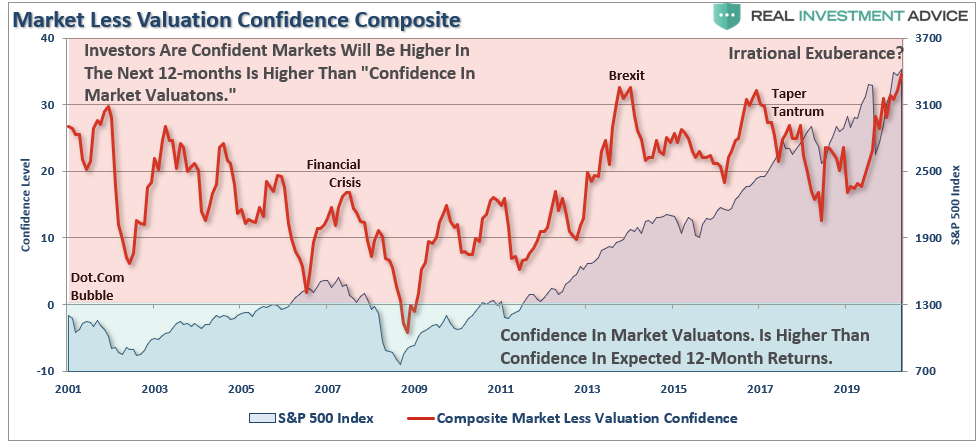
Yes, Virginia. We are in a stock market bubble.
Reflections
When thinking about excess, it is easy to see the reflections of excess in various places. Not just in asset prices but also in “stuff.” All financial assets are just claims on real wealth, not actual wealth itself. A pile of money has use and utility because you can buy stuff with it. But real wealth is the “stuff” — food, clothes, land, oil, and so forth. If you couldn’t buy anything with your money/stocks/bonds, their worth would revert to the value of the paper they’re printed on (if you’re lucky enough to hold an actual certificate).
But trouble begins when the system gets seriously out of whack.
“GDP” is a measure of the number of goods and services available, and financial asset prices represent the claims (it’s not a very accurate measure of real wealth, but it’s the best one we’ve got.) Notice the divergence of asset prices from GDP as excesses develop.
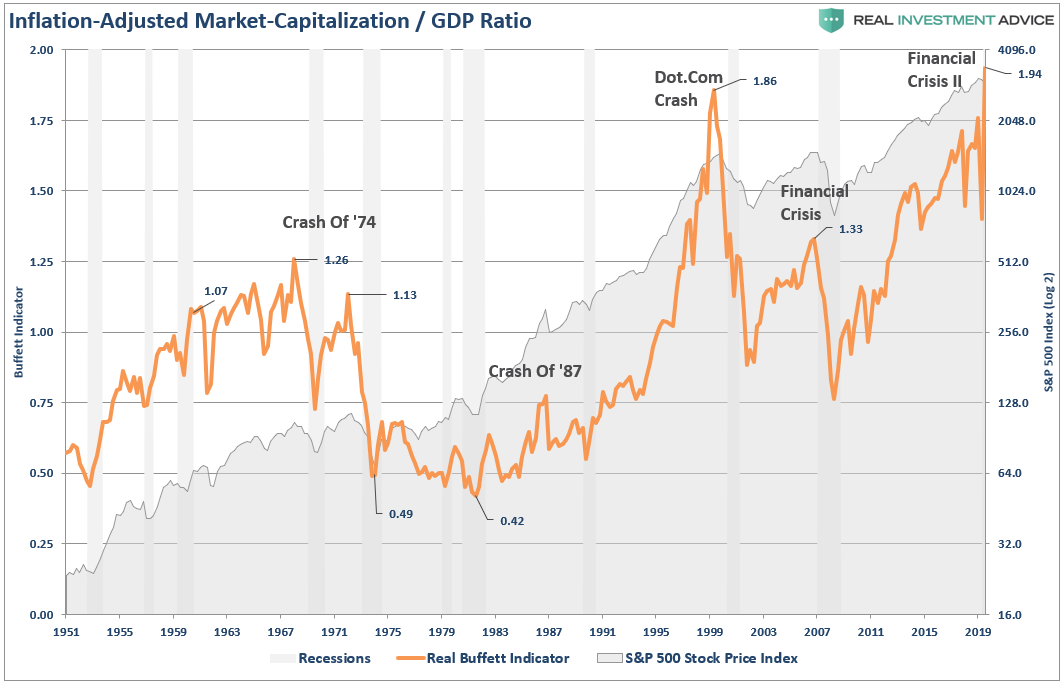
We see that the claims on the economy should, quite intuitively, track the economy itself. Excesses occur whenever the economy’s claims, the so-called financial assets (stocks, bonds, and derivatives), get too far ahead of the economy itself.
This Time Is Different
Such is an essential point.
“The claims on the economy are just that: claims. They are not the economy itself!”
Take a step back from the media and Wall Street commentary for a moment and make an honest assessment of the financial markets today.
The increase in speculative risks, combined with excess leverage, leave the markets vulnerable to a sizable future correction. The only missing ingredient for such a reversion is the catalyst to bring “fear” into an overly complacent marketplace.
It is all reminiscent of the market peak of 1929 when Dr. Irving Fisher uttered his now-famous words: “Stocks have now reached a permanently high plateau.”
This “time IS different.”
However, “this time” is only different from the standpoint the variables are not the same as they have been previously.
The variables never are. But the outcome is always the same.
But maybe it is the very “denial” of the bubble that suggests we are indeed in one.