
Trending

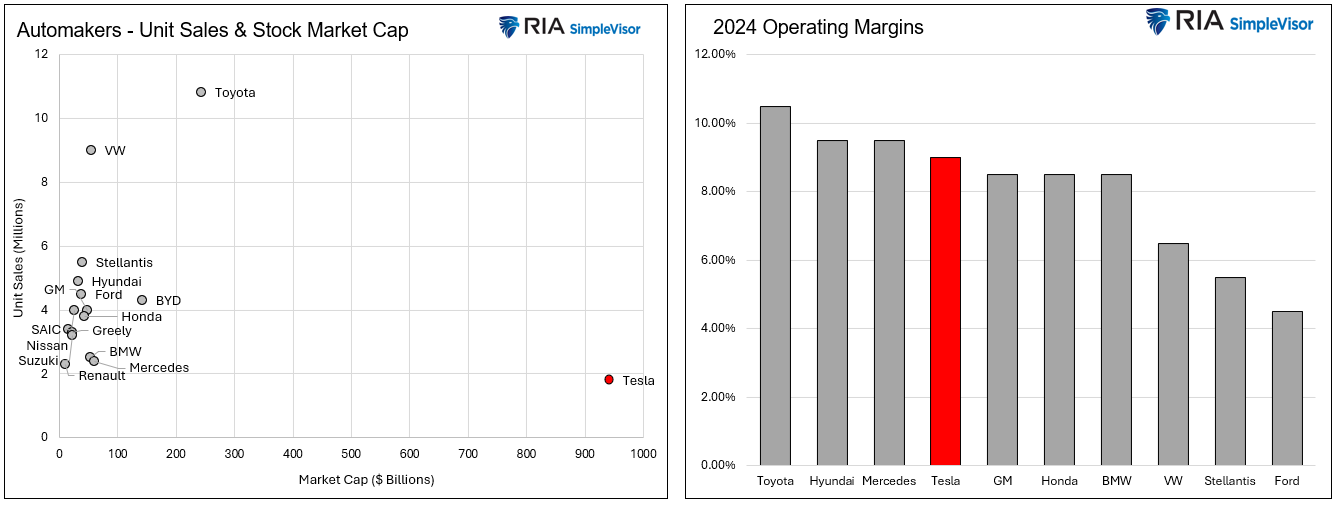
The graphs below highlight how expensive Tesla shares are compared to its competitors. The scatter plot on the left shows that Tesla shareholders are willing to pay an exorbitant price for its relatively minimal sales. Tesla’s market cap of $942 billion is $80 billion more than the combined market cap of the following fifteen largest automakers. Moreover, consider that they only sell 1.8 million cars per year. Such is less than Renault, which has the second lowest sales (2.3 million) of those charted. One reason that could explain the disconnect is profit margins. However, as seen in the second graph, Tesla’s margins align with those of its chief competitors. So, why are Tesla shareholders so bulled up?
To answer the question, let’s ask Grok, the AI solution from X, which is owned by Tesla’s CEO and largest shareholder, Elon Musk. Per Grok:
Tesla (TSLA) is poised for potential profit surges in the coming years due to its strategic positioning in the rapidly growing electric vehicle (EV) market, coupled with advancements in autonomous driving technology and energy storage solutions. As global demand for EVs accelerates—driven by stricter emissions regulations and consumer shifts toward sustainability—Tesla’s established brand, expansive Supercharger network, and production scalability give it a competitive edge over traditional automakers and new entrants alike. Additionally, the rollout of its Full Self-Driving (FSD) software could unlock high-margin revenue streams through subscriptions or licensing, while its energy division, including Powerwall and Megapack, taps into the booming renewable energy sector. With ongoing innovations, cost reductions in battery production, and potential expansion into new markets like India or robotics (e.g., Optimus), Tesla’s profitability could soar as it leverages its technological lead and diversified ecosystem.
As we highlight, we think Tesla’s biggest potential revenue generator and motivator for shareholders is its self-driving software (FSD). If Tesla can perfect automated driving, it could license the technology to their competitors. This would generate significant revenue and much higher profit margins. Of course, this assumes that Tesla’s FSD can not be replicated or bettered by its competitors.
What To Watch
Economy
Market Trading Update
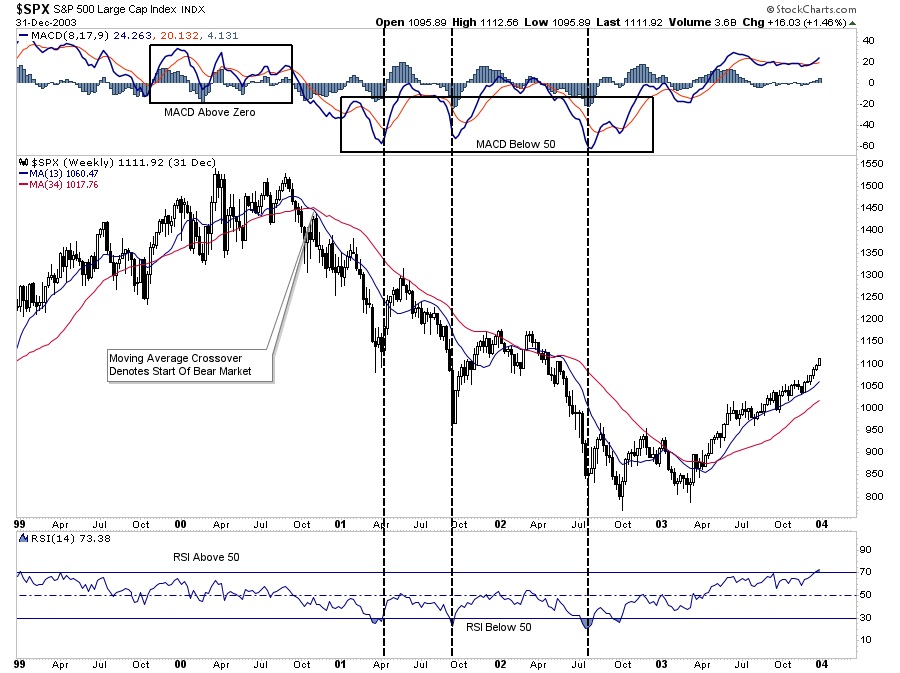
Yesterday, we touched on intra-year market declines, and despite only a normal market correction, participants are acting as if we are in the midst of a significant market contraction. Furthermore, we noted that previous oversold conditions, like today, have typically denoted market bottoms. However, this elicited many comments asking if this could be the beginning of a more protracted bear market. We will look at previous bear market periods over this century for clues.
During bull markets, relative strength tends to oscillate between 50 and 100, while the momentum, as measured by the MACD indicator, tends to stay above 50. The opposite is true is bear markets. During bull markets, buying opportunities tend to exist when corrections push indicators toward the lower levels of their weekly readings. Bear markets provide buying opportunities at the lowest levels.
However, the most critical indicator is the weekly moving average crossover. That crossover historically has been a strong indication that portfolios should become more “risk-off” positioned until that signal reverses. The crossover dictates the change in the market from a bullish to a bearish trend.
The charts below show the previous bear markets. Despite lots of volatility in late 1999, the signal to exit the market did not occur until October. Furthermore, even if you failed to exit at that signal, deep oversold conditions during 2001 provided decently counter-trend rallies to exit positioning as needed.
1999
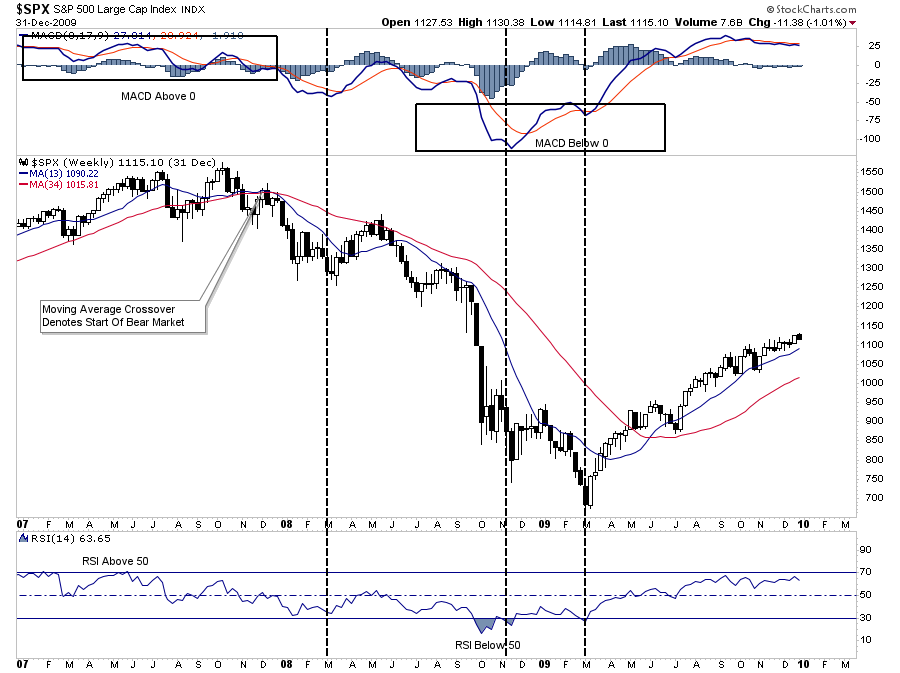
We see the same leading up to the financial crisis. During late 2007, there were plenty of warning signs that the market was topping. In late 2007, the market triggered a trend reversal signal with the moving average crossover. While the market declined in early 2008 as Bear Stearns failed, an oversold counter-trend rally from April to June provided an exit point to reduce exposure. Conversely, while volatile and painful, the deep oversold readings in November and March provided deep oversold opportunities to increase equity exposures.
2008
In 2022, after a feverish advance in 2021, the market signaled a trend change in March. The market then provided two more counter-trend rallies to reduce exposure during the year.
2022
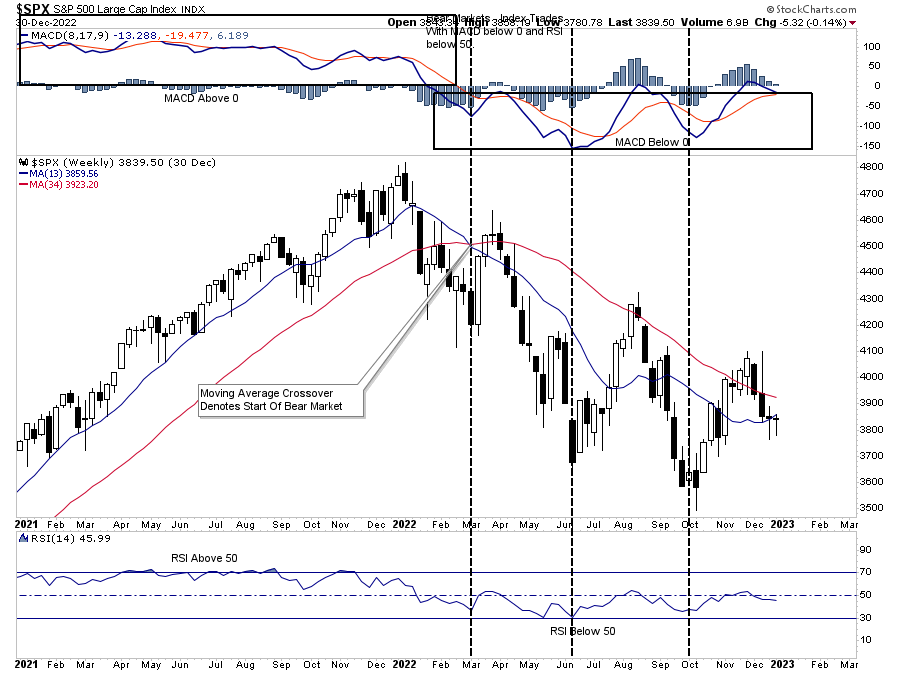
Where are we currently in 2025? First, while short-term oversold, all indicators remain in a “bull market” trend. Could that be changing? Yes. It will take time to tell. However, the most crucial indicator, the moving average crossover, has not signaled a trend reversal as of yet. Such should keep equity exposures elevated for a while longer. However, when the trend signal occurs, the market will likely be deeply oversold enough to provide a counter-trend rally to sell into.
2025

The message is that while headlines and sentiment are getting very bearish, the bull market remains technically intact. Will that eventually change? Yes. When it does, we will reduce equity exposures more aggressively. However, that is not the case for now, and trying to “guess” when it will happen often leads to many investing mistakes.
Continue to manage risk accordingly, but it is likely too soon to become overly bearish.
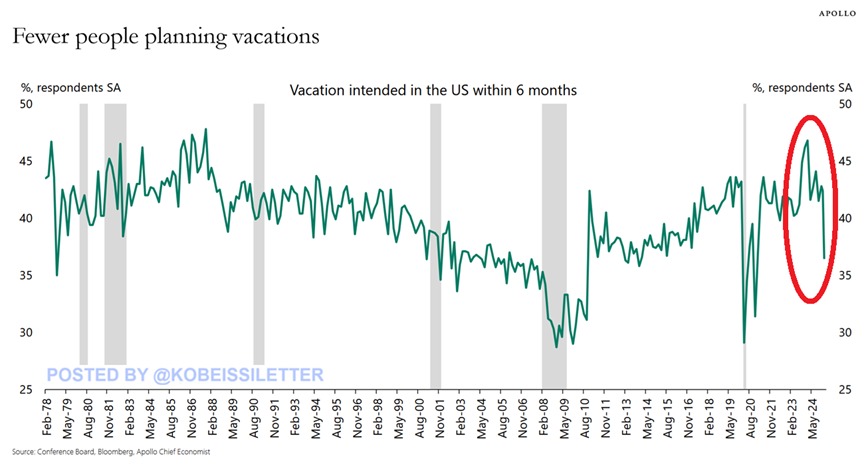
Vacation Plans Decline
The graph below, courtesy of the Kobeissi Letter and Apollo, shows that the percentage of people planning vacations has dropped significantly. This coincides with the decline in consumer confidence and the outlook for jobs. It’s fair to claim that consumers are retrenching fiscally. The question is whether this is temporary or a prolonged period that could weaken economic activity to the point of recession. Bear in mind that the data below and other sentiment readings are surveys. Personal politics can significantly impact survey results much more than consumers’ financial habits. Therefore, before jumping to conclusions, let’s see how weakening confidence manifests in economic data.
The Key Differences Between Active And Passive Investing And Which Is Right For You
When it comes to investing, there are two primary approaches: active investing and passive investing. Each strategy has its advantages and drawbacks, and selecting the right one depends on factors such as risk tolerance, time commitment, and financial goals.
In this article, we’ll explore the differences between active vs passive investing, the pros and cons of each approach, and how to decide which strategy aligns best with your investment objectives.

Tweet of the Day
“Want to achieve better long-term success in managing your portfolio? Here are our 15-trading rules for managing market risks.”
Related: Crude Oil Prices at a Crossroads: Will Support Hold?