Written by: Abhishek Ashok, M.A., MFE, CFA® | AGF
Every month, AGFiQ highlights the investment factors that are helping shape equity markets. Today’s focus is the synchronous underperformance of growth and momentum stocks.
It may not be today or tomorrow or the day after that, but sooner or later, most investors will recognize this year’s selloff in equity markets as an opportunity to buy some good stocks at discounted prices. In doing so, their instinct might be to seek out the hardest hit names of the recent correction, yet that might not be the best approach – at least from a factor perspective.
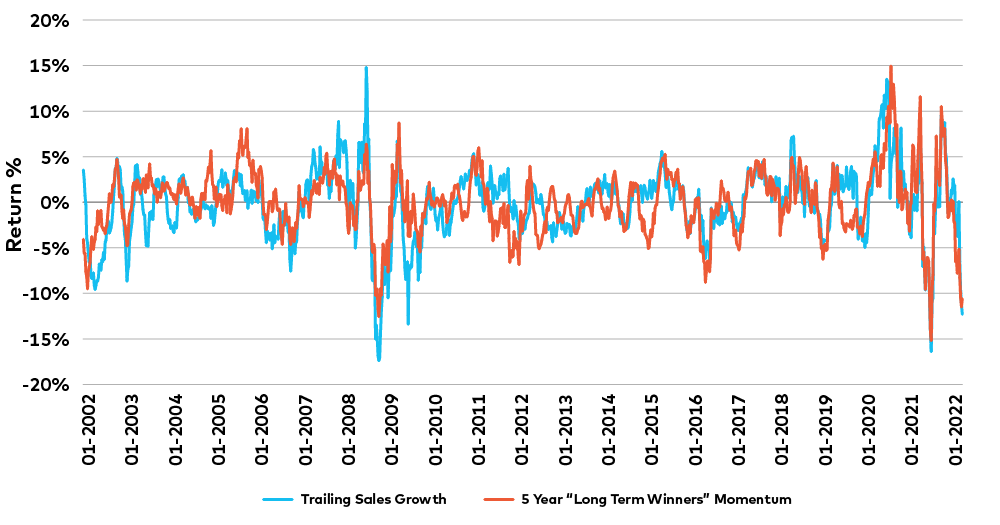
As a case in point, AGFiQ’s research shows that some of the worst performing equities of late are those that are characterized by one of either two factors: growth and momentum. For example, companies with high sales growth, one of the primary metrics that help define a growth stock, have underperformed the broader market by as much as 11.5% since the beginning of 2022, while companies that are long-term winners, a popular gauge of momentum stocks, have underperformed by 12%.
Synchronized Underperformance of Growth and Momentum Stocks

Source: AGFiQ with data from FactSet as of February 2, 2022. Chart measures the rolling 3-month performance spread between the Highest Sales Growth / Momentum (based on 5 Year Momentum) quintiles of stocks and the equal weighted performance of stocks within the largest 550 securities in the U.S. by market capitalization.
By those numbers, these sub-factors of growth and momentum might seem equally attractive to investors wanting to “buy on weakness,” but further analysis suggests that companies with high sales growth are much better valued today than are long-term winners and could represent the better opportunity of the two going forward.
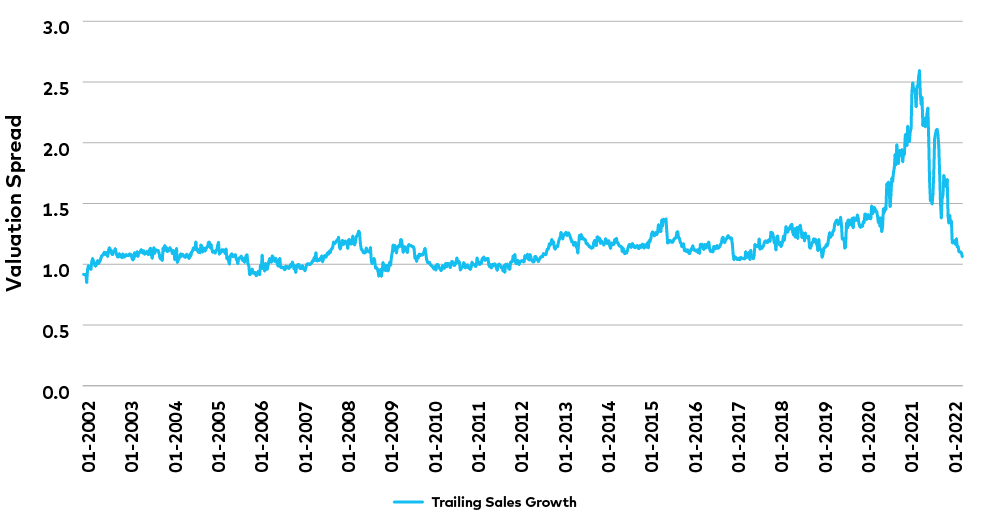
In fact, after trading at a multiple of roughly two and a half times greater than the broader U.S. market throughout most of the COVID-19 pandemic, companies with high sales growth are now trading closer to 1.1 times the market, or slightly lower than their historical multiple of 1.2 times the market.
Valuation Multiples: Companies with High Sales Growth

Source: AGFiQ with data from FactSet as of February 2, 2022. Chart measures the Forward Price to Earnings ratio of the Highest Sales Growth quintile of stocks relative to the market cap weighted Forward Price to Earnings ratio of all stocks within the largest 550 securities in the U.S. by market capitalization.
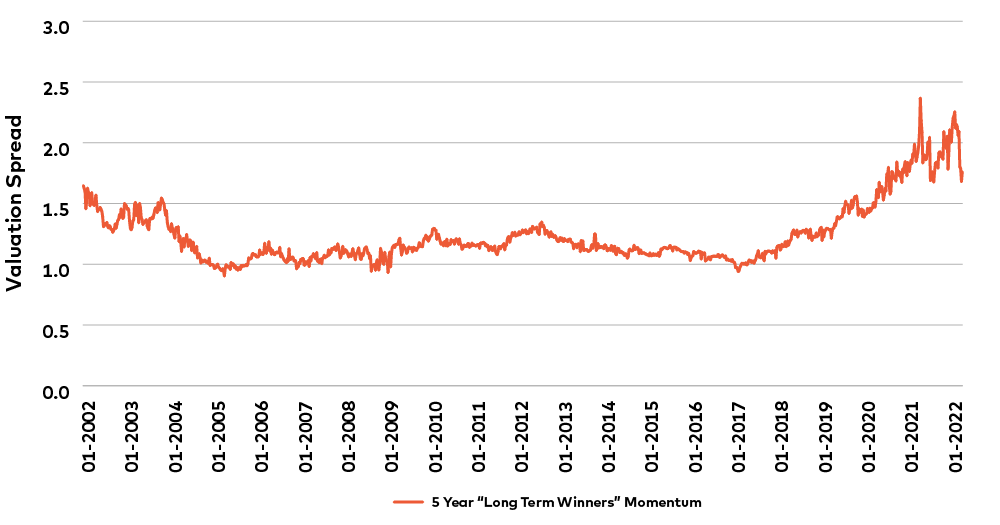
By comparison, long-term winners still seem expensive relative to the market. While the multiple for this group of momentum stocks has fallen from more than two times the market to roughly 1.7 times in recent weeks, it remains elevated in relation to the group’s historical average near 1.18 times.
Valuation Multiples: Long-term Winners

Source: AGFiQ with data from FactSet as of February 2, 2022. Chart measures the Forward Price to Earnings ratio of the Highest Momentum (based on 5 Year Momentum) quintile of stocks relative to the market cap weighted Forward Price to Earnings ratio of all stocks within the largest 550 securities in the U.S. by market capitalization.
Clearly, then, companies with high sales growth seem in much better position to rebound from the recent correction than those companies defined as long-term winners, but valuation may not be the only reason to believe the former may rally over the latter.
Our research also shows that 96% of high sales growth stocks are bolstered by positive forward earnings expectations, while only 86% of long-term winners have the same claim. Of course, that kind of advantage isn’t always fairly rewarded by investors, but it’s much more likely to be the case in a slower growth, rising rate environment like today, which usually benefits quality companies that have clean balance sheets, ample free cash flow and strong profitability profiles.
Ultimately, whether it’s high sales growth versus long-term winners or some other examples of synchronized underperformance of factors or sub-factors, the decision to buy into the market following a correction shouldn’t be based on how much a stock has dropped in price but on how much it might rise based on its current valuation in relation to the market and the underlying fundamentals of the company.
Related: Investing Your Way Through a Correction
The views expressed in this blog are those of the authors and do not necessarily represent the opinions of AGF, its subsidiaries or any of its affiliated companies, funds, or investment strategies.
The commentaries contained herein are provided as a general source of information based on information available as of February 8, 2022 and are not intended to be comprehensive investment advice applicable to the circumstances of the individual. Every effort has been made to ensure accuracy in these commentaries at the time of publication, however, accuracy cannot be guaranteed. Market conditions may change and AGF Investments accepts no responsibility for individual investment decisions arising from the use or reliance on the information contained here.
References to specific securities are presented to illustrate the application of our investment philosophy only and do not represent all of the securities purchased, sold or recommended for the portfolio. It should not be assumed that investments in the securities identified were or will be profitable and should not be considered recommendations by AGF Investments.
This document is intended for advisors to support the assessment of investment suitability for investors. Investors are expected to consult their advisor to determine suitability for their investment objectives and portfolio.
AGFiQ is a quantitative investment platform powered by an intellectually diverse, multi-disciplined team that combines the complementary strengths of investment professionals from AGF Investments Inc. (AGFI), a Canadian registered portfolio manager, and AGF Investments LLC (AGFUS), a U.S. registered adviser.
AGF Investments is a group of wholly owned subsidiaries of AGF Management Limited, a Canadian reporting issuer. The subsidiaries included in AGF Investments are AGF Investments Inc. (AGFI), AGF Investments America Inc. (AGFA), AGF Investments LLC (AGFUS) and AGF International Advisors Company Limited (AGFIA). AGFA and AGFUS are registered advisors in the U.S. AGFI is registered as a portfolio manager across Canadian securities commissions. AGFIA is regulated by the Central Bank of Ireland and registered with the Australian Securities & Investments Commission. The subsidiaries that form AGF Investments manage a variety of mandates comprised of equity, fixed income and balanced assets.


