
Trending

Crude oil prices have fallen by 10% over the last five days and nearly 20% since early April.
As we will share, a few factors are negatively impacting the price of crude oil. First, OPEC surprised the markets this past weekend. They agreed to extend most of its production cuts to next year but are phasing out voluntary cuts. The deal appears to be an underhanded way of increasing production. Further pushing crude oil lower is a growing likelihood of a cease-fire agreement in Gaza. Importantly, an agreement could include broader peace agreements extending through the Middle East. Lastly, the recent slowing of economic activity in the U.S. and continued poor economic growth in China are weakening the demand for crude oil. Along those lines, the EIA recently shared that U.S. demand for diesel fell to its lowest seasonal level in over 25 years. Per Reuters:
Products supplied of distillate, EIA’s measure of demand, fell over 6% from February to 3.67 million barrels per day (bpd) in March, lowest for the month since 1998.
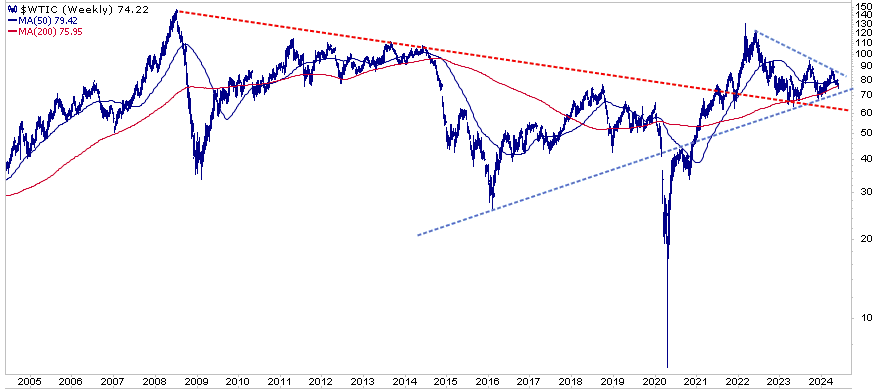
The long-term crude oil graph below, using a log scale y-axis, shows that the price of crude oil has formed a wedge pattern over the last two years. Typically, the price breaks out of wedge patterns with a sharp move higher or lower. A break lower would be troublesome, as the blue dotted support line has been dependable support for nearly ten years, except for the early days of the pandemic. Further, a break lower could result in the 50-week moving average crossing below the 200-week moving average. The price of crude oil sits on its 200-week moving average, which has been good support for the last year. On the bullish side, the trend has been upward for eight years, and a break above the dotted blue resistance line could propel crude oil prices back closer to $100.
What To Watch
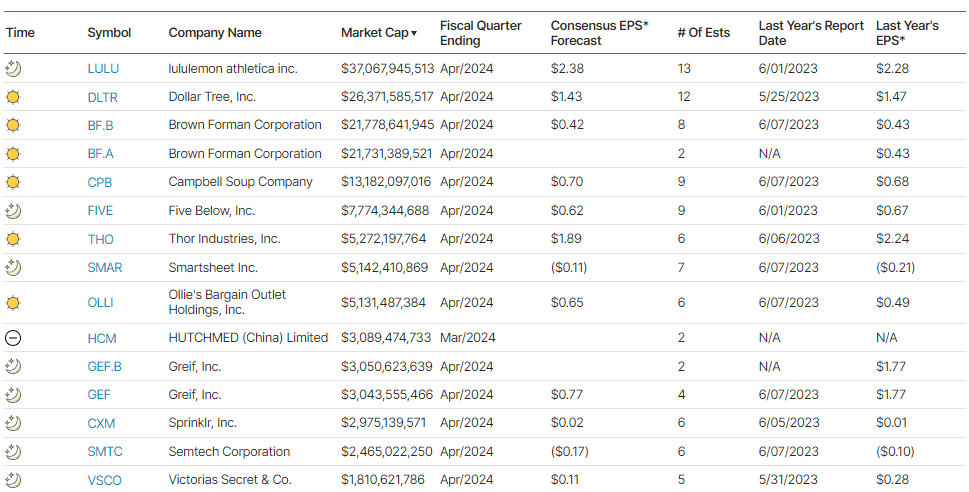
Earnings
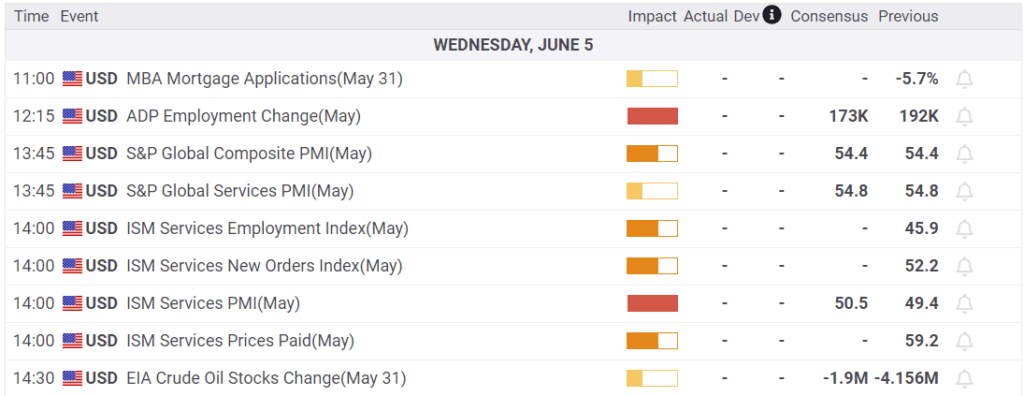
Economy
Market Trading Update
As we have noted over the last few days, there is nothing seemingly “wrong” with the market that would require investors to take a more defensive posture. However, with that said, since we tend to be more “risk averse” by nature, we do pay attention to internal signals that could suggest that risk is rising.
One thing that we do pay attention to is market breadth. When the stock market rises, it should be accompanied by a rising number of stocks trading above their respective 50- and 200-DMAs. The opposite is true during declining markets. However, there are times when breadth does not confirm the market’s current bullish or bearish trend. These “negative divergences” are often worth paying attention to as they suggest that underlying weaknesses or strengths in the market may exist.
While the market has rallied fairly sharply from the April lows, the number of stocks trading above their respective 50 and 200-DMA is mostly unchanged. There are periods when the market has rallied despite weak participation, but more often than not, this is a sign worth paying attention to. If the current market rally will continue higher over the next few months, we need to see broader participation in the market to support that rise. Otherwise, if that breadth continues to narrow, any upside is likely going to be very limited.
As Bob Farrell once wrote:
Rule #7. “Markets are strongest when they are broad, and weakest when they narrow to a handful of blue-chip names”

Small Caps And Bonds Are Well-correlated
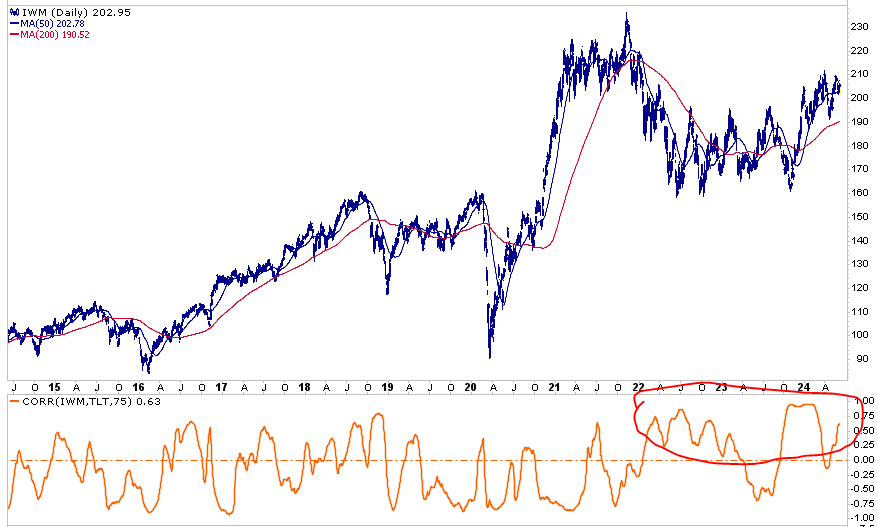
The graph below shows that bond prices and the Russell 2000 small-cap index have been well-correlated since bond yields started rising in 2022. Small-cap stock earnings tend to be more sensitive to debt costs and have less access to the capital markets to meet their borrowing needs. Furthermore, banks have been running conservative lending policies, disproportionately affecting smaller companies more than larger ones. If the recent downtick in yields due to weakening economic activity holds, we might expect the small-cap sector to lead the market. Mind you, it is too early, and there is insufficient data to make such an economic claim at this point.
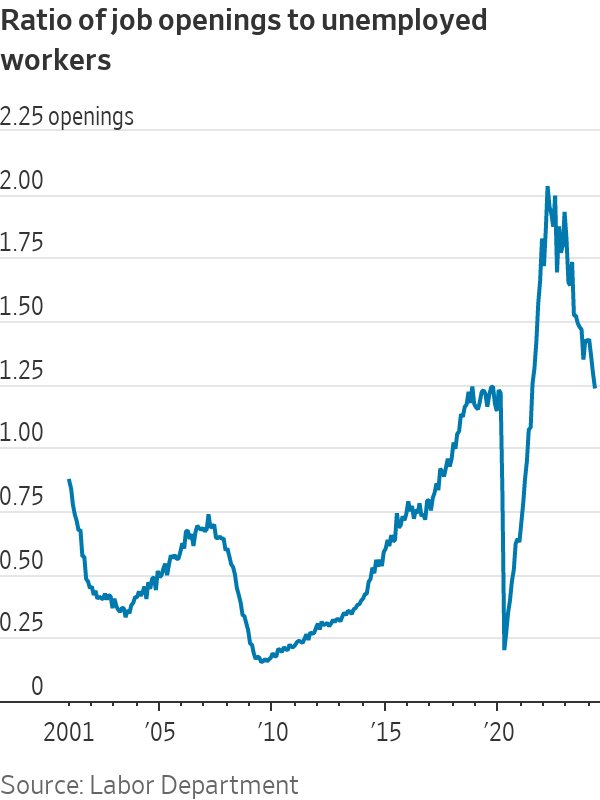
JOLTs
In the latest JOLTs report, the number of job openings fell below 8.1 million to its lowest level since February 2021. Expectations were for 8.4 million. The graph below further indicates that the jobs market is normalizing. It shows the ratio of job openings to the number of unemployed is back to its pre-pandemic peak. The quits rate and hires rate are also back to pre-pandemic levels. We suspect that expectations for Friday’s employment figures will decline slightly on the JOLTs data.
Tweet of the Day

“Want to achieve better long-term success in managing your portfolio? Here are our 15-trading rules for managing market risks.”