Written by: Abhishek Ashok, M.A., MFE, CFA® | AGF Investments Inc.
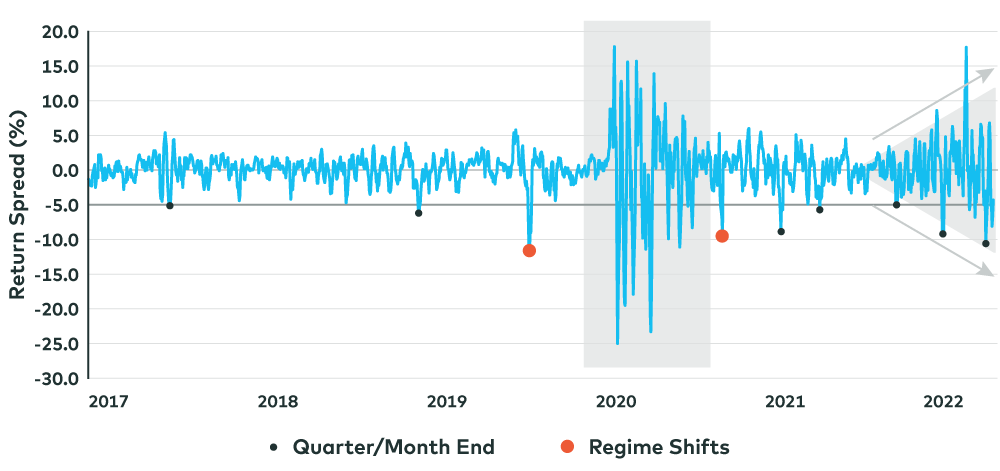
Momentum is a hot topic with factor investors these days, mainly because of the volatility that has been associated with it in recent weeks. Case in point, our research shows that rolling one-week return spreads for U.S. stocks with the greatest momentum over a six-month period – versus those with the least – have been oscillating from positive to negative in a way that is reminiscent of the early part of the pandemic in 2020, albeit not quite so extreme (Illustration 1).
But its not just those with direct exposure to this kind of volatility that should be taking notice. Also important is the notion that big moves in momentum stocks often reflect shifting dynamics in equity markets more broadly and can sometimes be a signal of imminent changes in the direction of them.
For instance, significant drawdowns in momentum stocks can sometimes coincide with regime shifts that result in certain underperforming factors and/or sectors of the market turning into outperformers and vice versa. One of the best examples of this was in the fall of 2020 when value stocks went from laggards of growth stocks to leaders of them following the approval of the first COVID-19 vaccine in the United States.
Still, the relationship between significant drawdowns and regimes shifts doesn’t always hold, including when momentum volatility is particularly high. In this case, larger-than-normal drawdowns in momentum stocks can happen at the end of a month or quarter simply because investors have decided to lock in outsized gains that preceded the drawdowns as part of a regular rebalancing. In fact, that seems to be what investors have been experiencing over the past weeks. Even though momentum drawdowns have been large of late, there hasn’t been a clear-cut regime-shifting event to explain them —at least not to date.
Momentum Drawdowns: Regime Shift or Rebalancing?

Source: AGFiQ using data from FactSet as of June 30, 2022. One- week rolling return spread between the highest and lowest stocks based on six-month price change (quintiles) within sectors in the top 1200 securities in the United States by market capitalization.
Either way, it’s also interesting to note the underlying characteristics of momentum stocks today and whether that might be what’s causing them to be more volatile than usual.
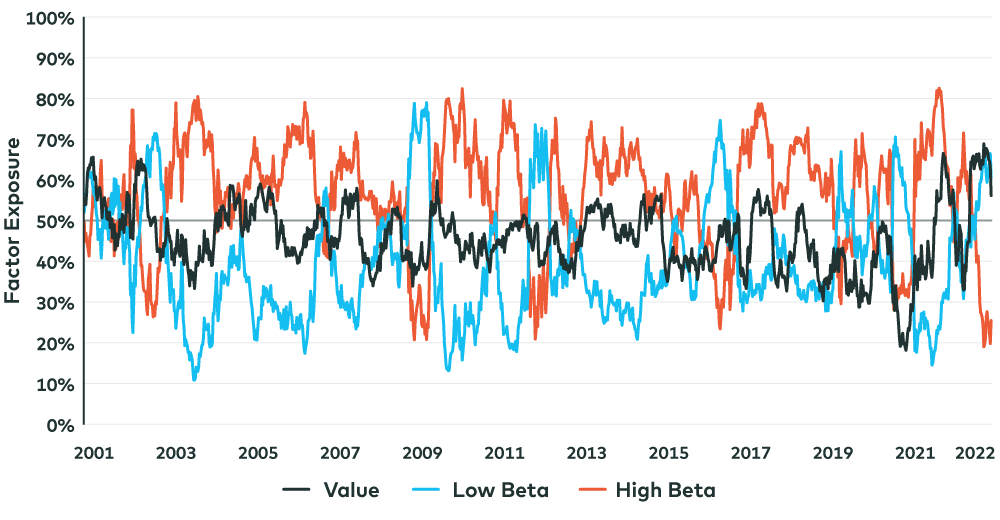
Our research shows that value exposure has never been higher in U.S. stocks with the best six-month momentum than it is now, while beta exposure has never been less (Illustration 2). Of course, this makes sense given the recent performance, especially in value, which has recovered in the past 15 months all the cumulative gains it unwound in the three years before that.
Factor Exposures of U.S. Momentum Stocks

Source: AGFiQ using data from FactSet as of June 30, 2022. Factor exposure of the stocks with the best six-month price change (quintiles) in the top 1200 securities in the United States by market capitalization.
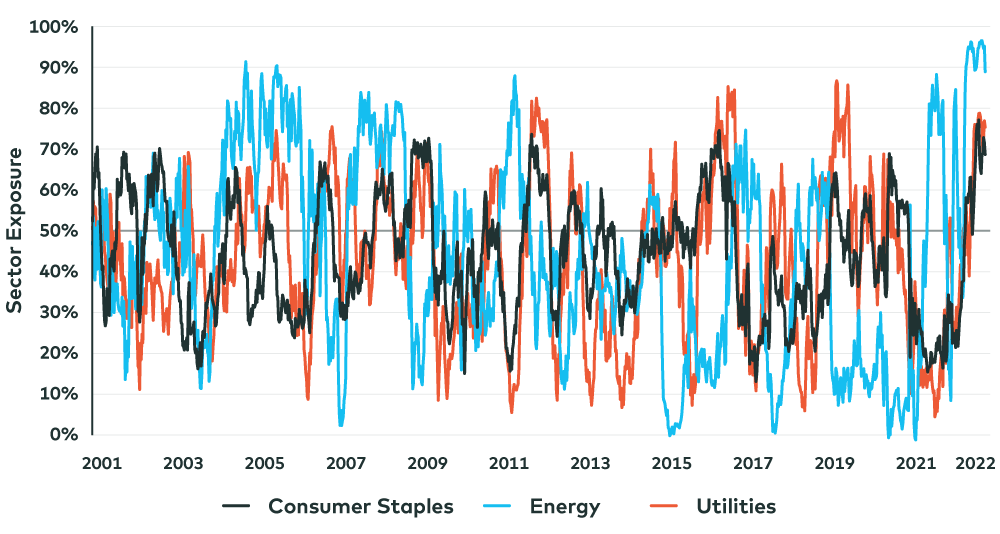
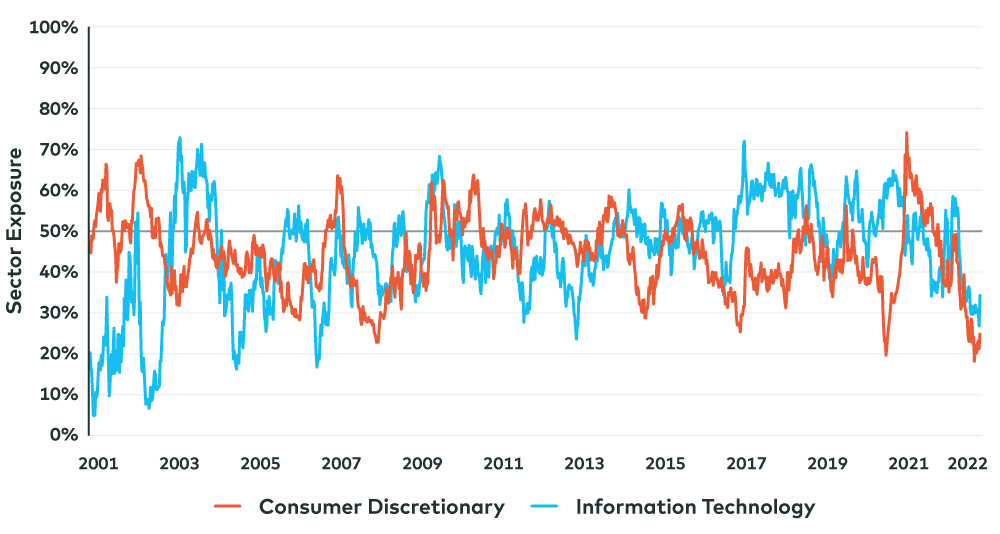
A similar pattern of extremes is also evident when analyzing the sector makeup of U.S. momentum stocks right now (Illustration 3). This includes more exposure to energy than ever before and historically high exposure to defensive sectors like consumer staples and utilities. On the flip side, our research also shows exposure to information technology and consumer discretionary is close to 20-year lows.
Sector Exposures of U.S. Momentum Stocks


Source: AGFiQ using data from FactSet as of June 30, 2022. Six-month price change exposure of sectors in the top 1200 securities in the United States by market capitalization.
All in, then, it seems that momentum volatility is being amplified by both underlying factor and sector exposures that have turned extreme relative to history. And while a regime shift may not be in the cards just yet, investors should be ready for more ups and downs in momentum stocks as some of the imbalances in their makeup begin to normalize in the weeks ahead.
Related: Why the U.S. Dollar is King for Now
The views expressed in this blog are those of the authors and do not necessarily represent the opinions of AGF, its subsidiaries or any of its affiliated companies, funds, or investment strategies.
The commentaries contained herein are provided as a general source of information based on information available as of July 26, 2022 and are not intended to be comprehensive investment advice applicable to the circumstances of the individual. Every effort has been made to ensure accuracy in these commentaries at the time of publication, however, accuracy cannot be guaranteed. Market conditions may change and AGF Investments accepts no responsibility for individual investment decisions arising from the use or reliance on the information contained here.
References to specific securities are presented to illustrate the application of our investment philosophy only and do not represent all of the securities purchased, sold or recommended for the portfolio. It should not be assumed that investments in the securities identified were or will be profitable and should not be considered recommendations by AGF Investments.
AGFiQ is a quantitative investment platform powered by an intellectually diverse, multi-disciplined team that combines the complementary strengths of investment professionals from AGF Investments Inc. (AGFI), a Canadian registered portfolio manager, and AGF Investments LLC (AGFUS), a U.S. registered adviser.
AGF Investments is a group of wholly owned subsidiaries of AGF Management Limited, a Canadian reporting issuer. The subsidiaries included in AGF Investments are AGF Investments Inc. (AGFI), AGF Investments America Inc. (AGFA), AGF Investments LLC (AGFUS) and AGF International Advisors Company Limited (AGFIA). AGFA and AGFUS are registered advisors in the U.S. AGFI is registered as a portfolio manager across Canadian securities commissions. AGFIA is regulated by the Central Bank of Ireland and registered with the Australian Securities & Investments Commission. The subsidiaries that form AGF Investments manage a variety of mandates comprised of equity, fixed income and balanced assets.


