
Trending

Written by: Matt Gentzkow | Waddell and Associates
THE BOTTOM LINE:
We closed out January and now we turn our calendars to February! This week, I give you my favorite charts from the month of January. They highlight key insights, including how historical market trends in January can signal the year’s outlook, the importance of long-term earnings growth and fundamentals, and additional context for this cyclical bull market. A shorter read, but often, a picture is worth a thousand words!
Chart #1: ‘The January Effect’
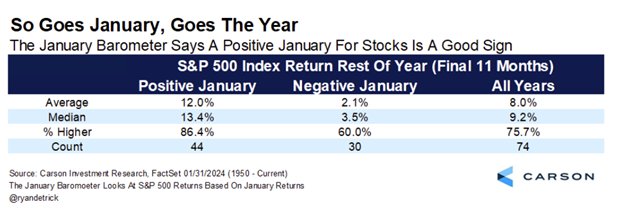
Many in the industry use technical analysis, which is a term for the evaluation of the trend in price and patterns to forecast future price movements. Ironically, it’s called technical analysis, but it’s also behavioral finance: Market participants make future decisions based on price movements. One of the technical indicators used by strategists is the ‘January Effect’: So goes January market performance, so (typically) returns follow the rest of the year. Historically, a positive January return in the S&P 500 index results in a 12% return for the remaining 11 months 86% of the time. If January returns are negative, the average remaining annual return is 2.1% but at only a 60% hit rate. Of course, no one technical signal is the end-all, but it is helpful context for understanding that market strength often begets more strength on a calendar year basis. With the S&P 500 up 2.7% in January, the case for a positive year has only strengthened.
Chart #2: Back to the Fundamentals!
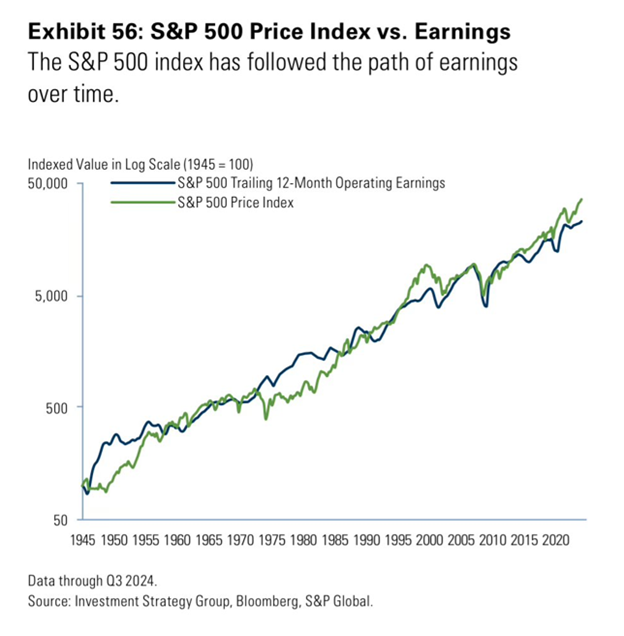
This is a good one. News, fear, and flows guide short-term price action, but it’s underlying corporate earnings that guide long-term price action. A slowing or accelerating rate of change in earnings drives the price. The wisdom here is that time in the market is more important than market timing. There are periods of time where earnings growth outpaces underlying index price growth, and vice versa, but over the long-run, historical earnings matter, and they typically grow over time.
Chart #3: It’s Still a Bull Market, For Now.
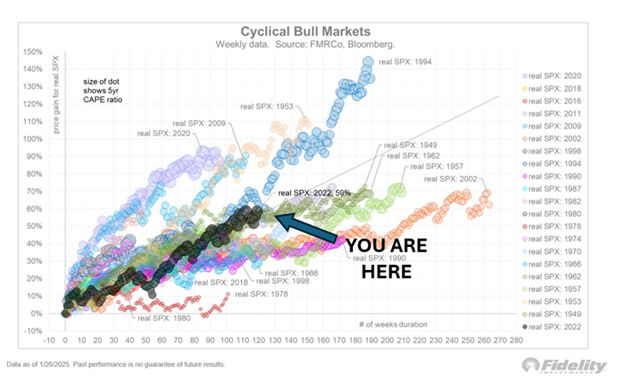
Finally, a historical look at cyclical bull markets and weekly S&P 500 returns therein. As you can see, our current cyclical bull market from the lows of 2022 indicates this bull market is looking historically healthy. Conditions and overall narratives are different across the variety of market timeframes, but the only question is how long this one will last. Yes, cross-sectionally in time, valuations are elevated, and past-performance is no guarantee of future returns, but so far, we are tracking along nicely with previous bull market cycles.
That is all for this week. Enjoy the rest of your weekend!
Related: What Investors Should Know About China's 2025 Market Prospects
Sources: @Jurrien Timmer, Fidelity Investments, @Ryan Detrick, Carson Investment Research, Bloomberg, S&P Global, YCharts