
Trending

The January Goods Trade Deficit fell to a record -$153 billion versus expectations of -$116 billion. Moreover, as we share below, courtesy of MacroBond, the monthly decline of $31 billion is more than double any other instance since 1955. Imports rose by 12% while exports increased by 2%. The steep decline in the trade deficit is primarily due to US companies front-running tariffs. Approximately $22 billion of the $31 billion, or about two-thirds of the decline, came from industrial supplies. Consumer goods ($4 billion), food and beverages ($2 billion), and other goods ($2.3 billion) account for the bulk of the rest of the change. A similar large trade deficit will likely be reported for February.
The steep decline, mainly due to tariffs, will likely normalize over the coming months. The import demand will be less than typical as inventories for specific products are now bloated for those frontrunning the tariffs. However, the trade deficit data will negatively impact GDP. The formula for GDP includes exports minus imports. The Atlanta Fed GDP Now estimate for first quarter GDP fell sharply from 2.3% on February 19 to -1.5% on Friday, after the trade deficit report. Per the Atlanta Fed, the trade deficit will impact GDP by -3.70 %. Before the trade data, they estimated the effect would be -.41%,

What To Watch
Earnings

Economy

Market Trading Update
es that gained the market’s attention, the reality was that the market was overbought and on a sell signal, setting the market up for pullback. The correction was not unexpected, as discussed three weeks ago:
“The bullish bias is evident, as witnessed by the recent surge in retail money flows into leveraged ETFs and speculative options trading. However, as is always the case, whenever investors are crowded on “one side of the boat,” it is often a decent contrarian signal to be a bit more cautious. Furthermore, while there is currently no evidence of a catalyst for a correction, it is worth noting that we are entering into the seasonally weak part of February.”

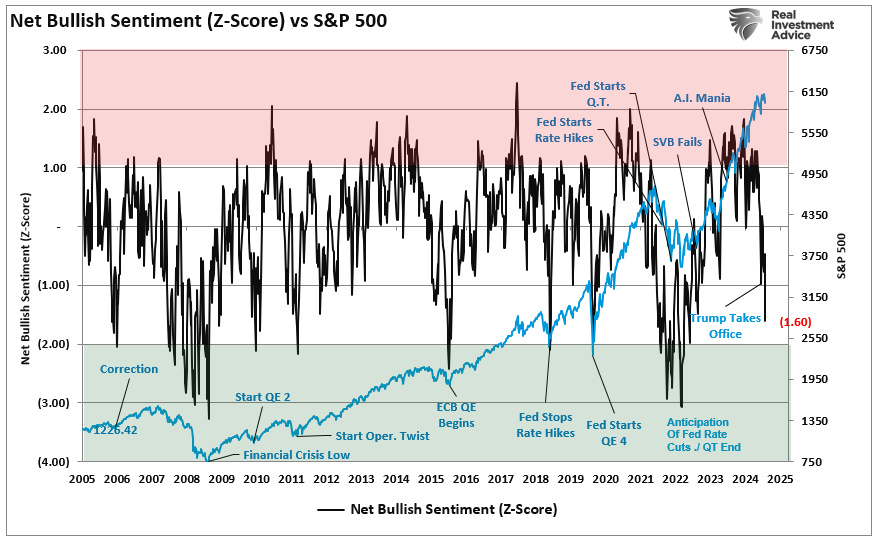
In other words, while the media scrambled to align reasons with the sell-off, the correction was very much in line with seasonal tendencies. Crucially, that sell-off has pushed investor sentiment to levels typically equating to much deeper corrections. From a contrarian view, that extreme negative sentiment, now combined with oversold conditions, provides a good base for a rally in March.
“Sentiment is approaching two standard deviations below its average level. Such levels are more coincident with market bottoms than the beginning of a corrective cycle. I have labeled some events along the way. The lesson is that headlines drive sentiment, and when sentiment becomes too negative, as may be the case today, such allows for rallies to form.”
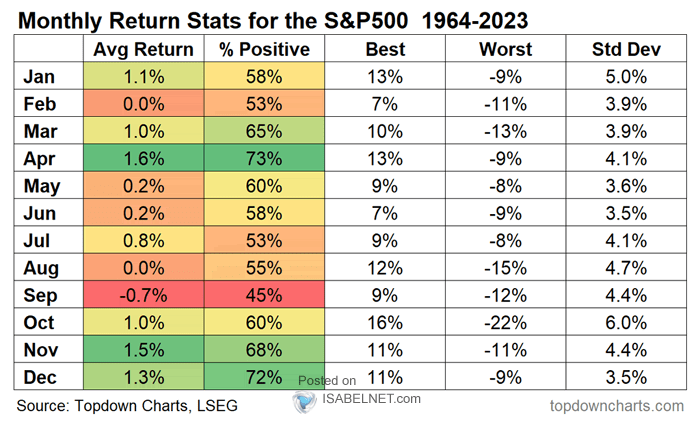
Furthermore, March has a seasonal bias to the upside as we enter the end of the quarter and the last stretch of the seasonally strong period of the year. January, March, and April have the strongest early-year returns, with March and April having the highest win rates.
Does this mean the next major bull market rally is set to begin? No. But it does suggest that there are such high levels of negative sentiment that selling today will likely be a mistake. Loss avoidance is one of the psychological factors that leads investors to long-term underperformance. With market sentiment very negative and becoming decently oversold, be patient and wait for a tradeable rally to rebalance portfolio positions as needed. For traders, a decent tradable opportunity is likely in the near term.
However, while there is a potential for a decent tradeable rally over the next month or so, we still expect increased volatility this year. We want to reiterate using rallies to rebalance risk and manage allocations as needed.
The Week Ahead
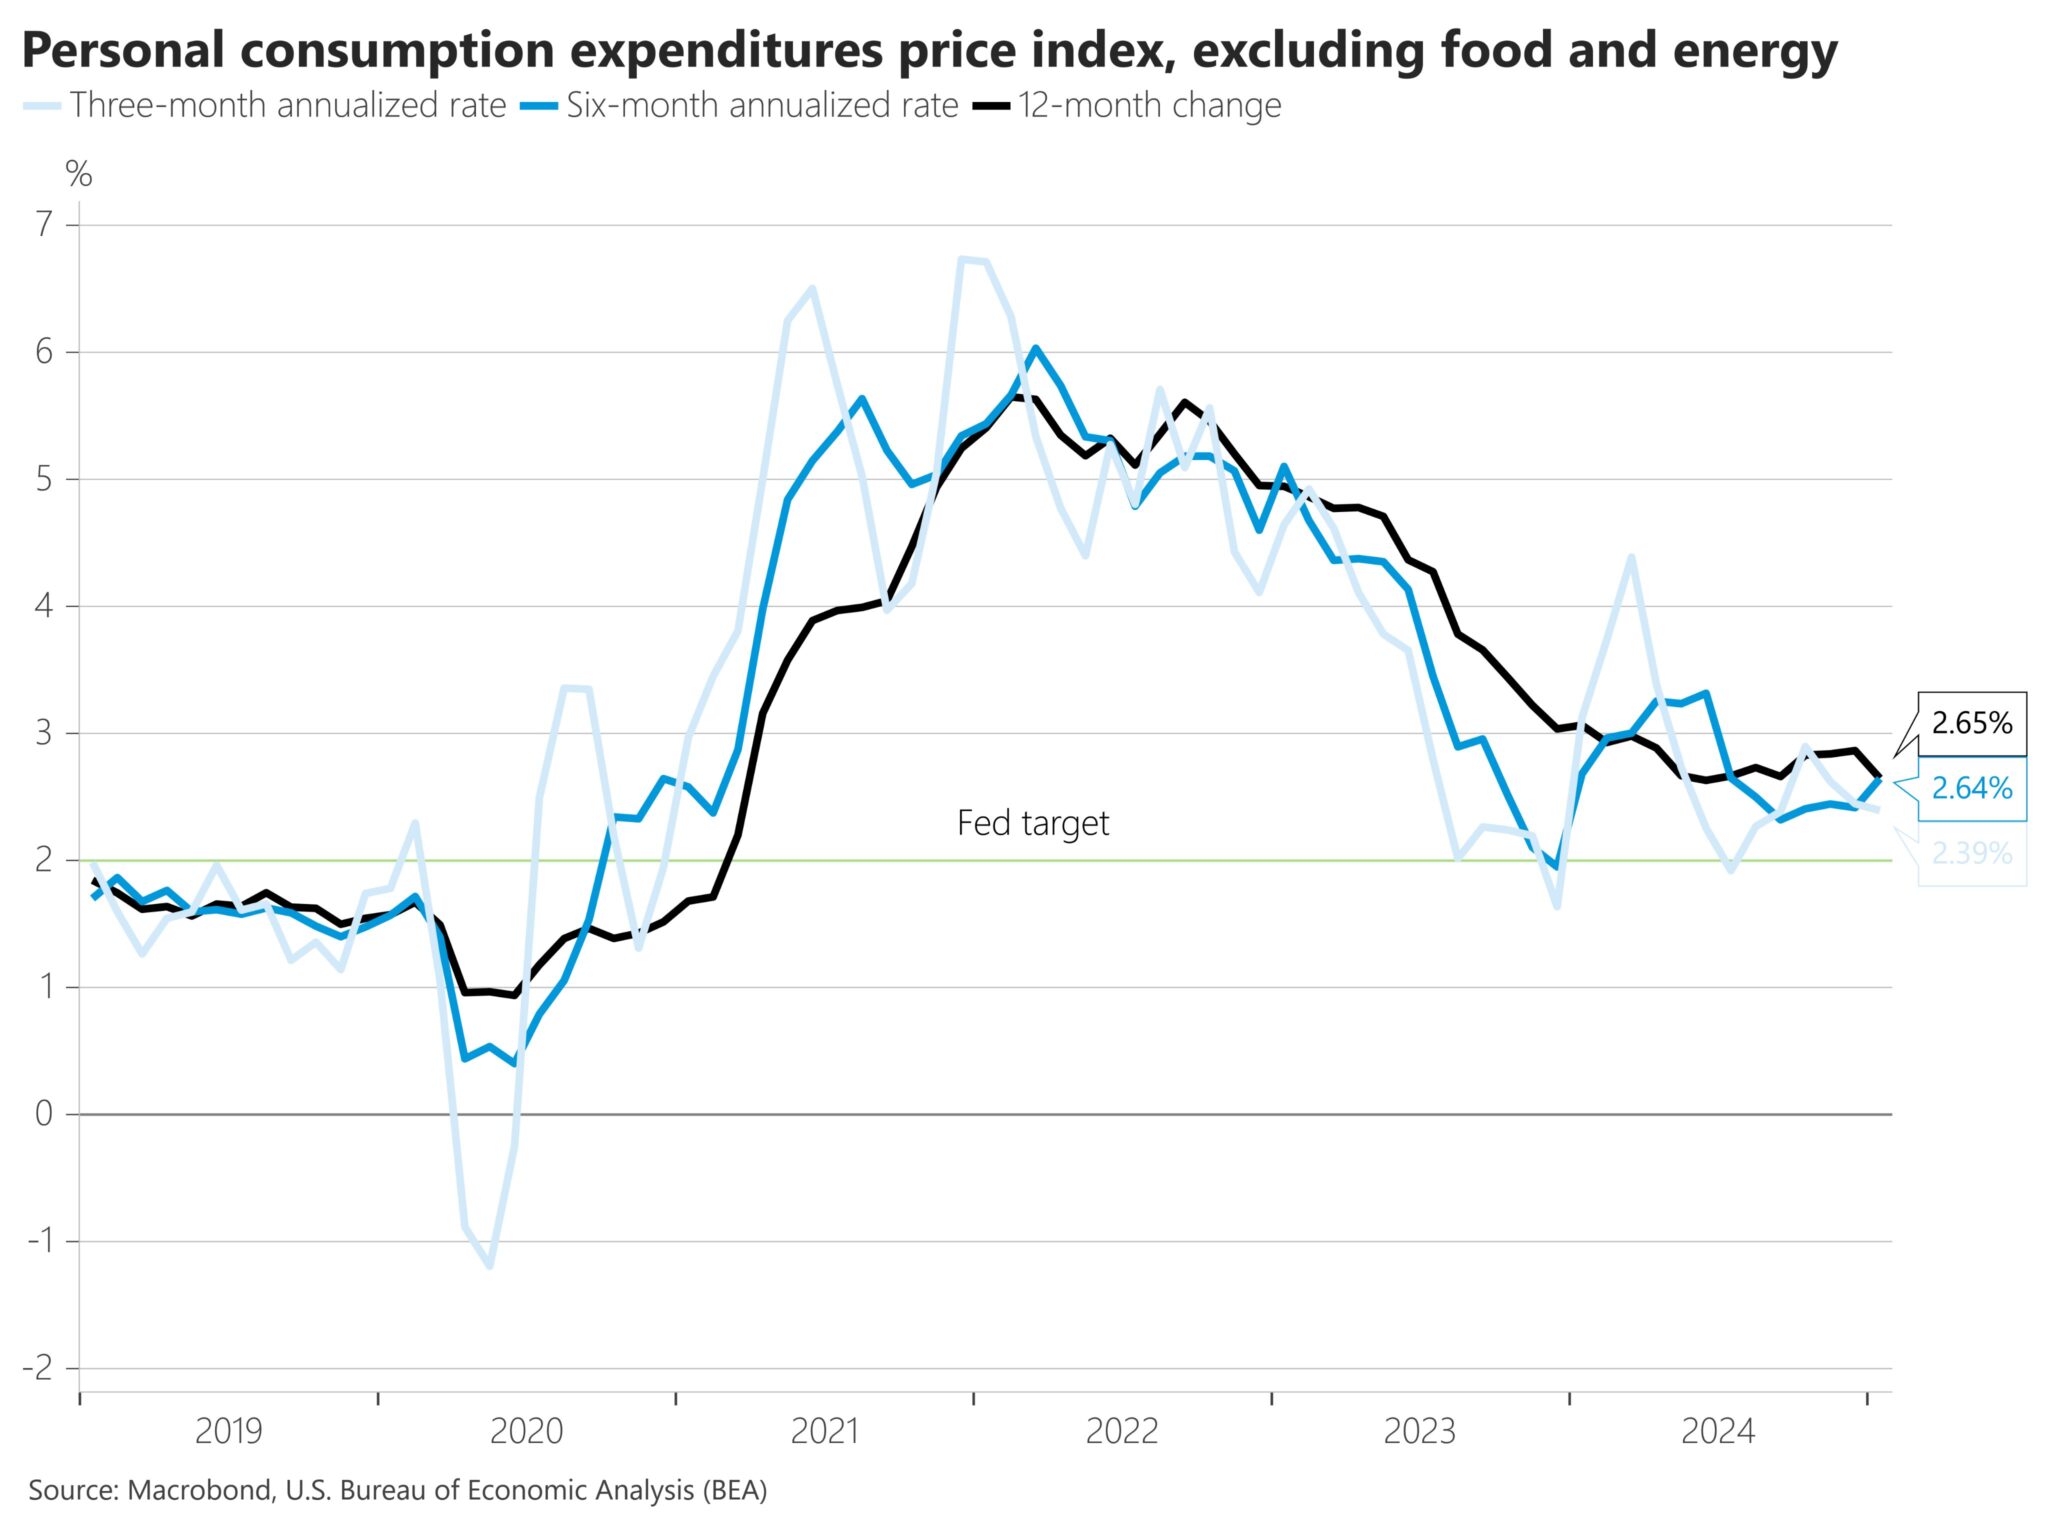
Circling back to last Friday, PCE prices met expectations. The core and the broader monthly price index rose by 0.3%. The year-over-year rate fell from 2.6% to 2.5%. Moreover, the core fell from 2.9% to 2.6%. It’s also worth mentioning that personal spending fell by 0.2%, confirming the weak retail sales and recent consumer confidence data.
The manufacturing and service sector ISM reports will be released on Monday and Wednesday. The tariffs will likely figure into both reports. Thus, we should expect some weakness as those surveyed are likely more uncertain about the future. Also of interest will be the round of jobs data. JOLTs, ADP, and the BLS report will inform us of the impact, if any, of government layoffs. The current consensus is for a gain of 135k jobs, which aligns with last month’s +143k jobs. Therefore, Wall Street doesn’t expect to see a material change in the number of government jobs.
CAPE 5- A Different Measure Of Valuation
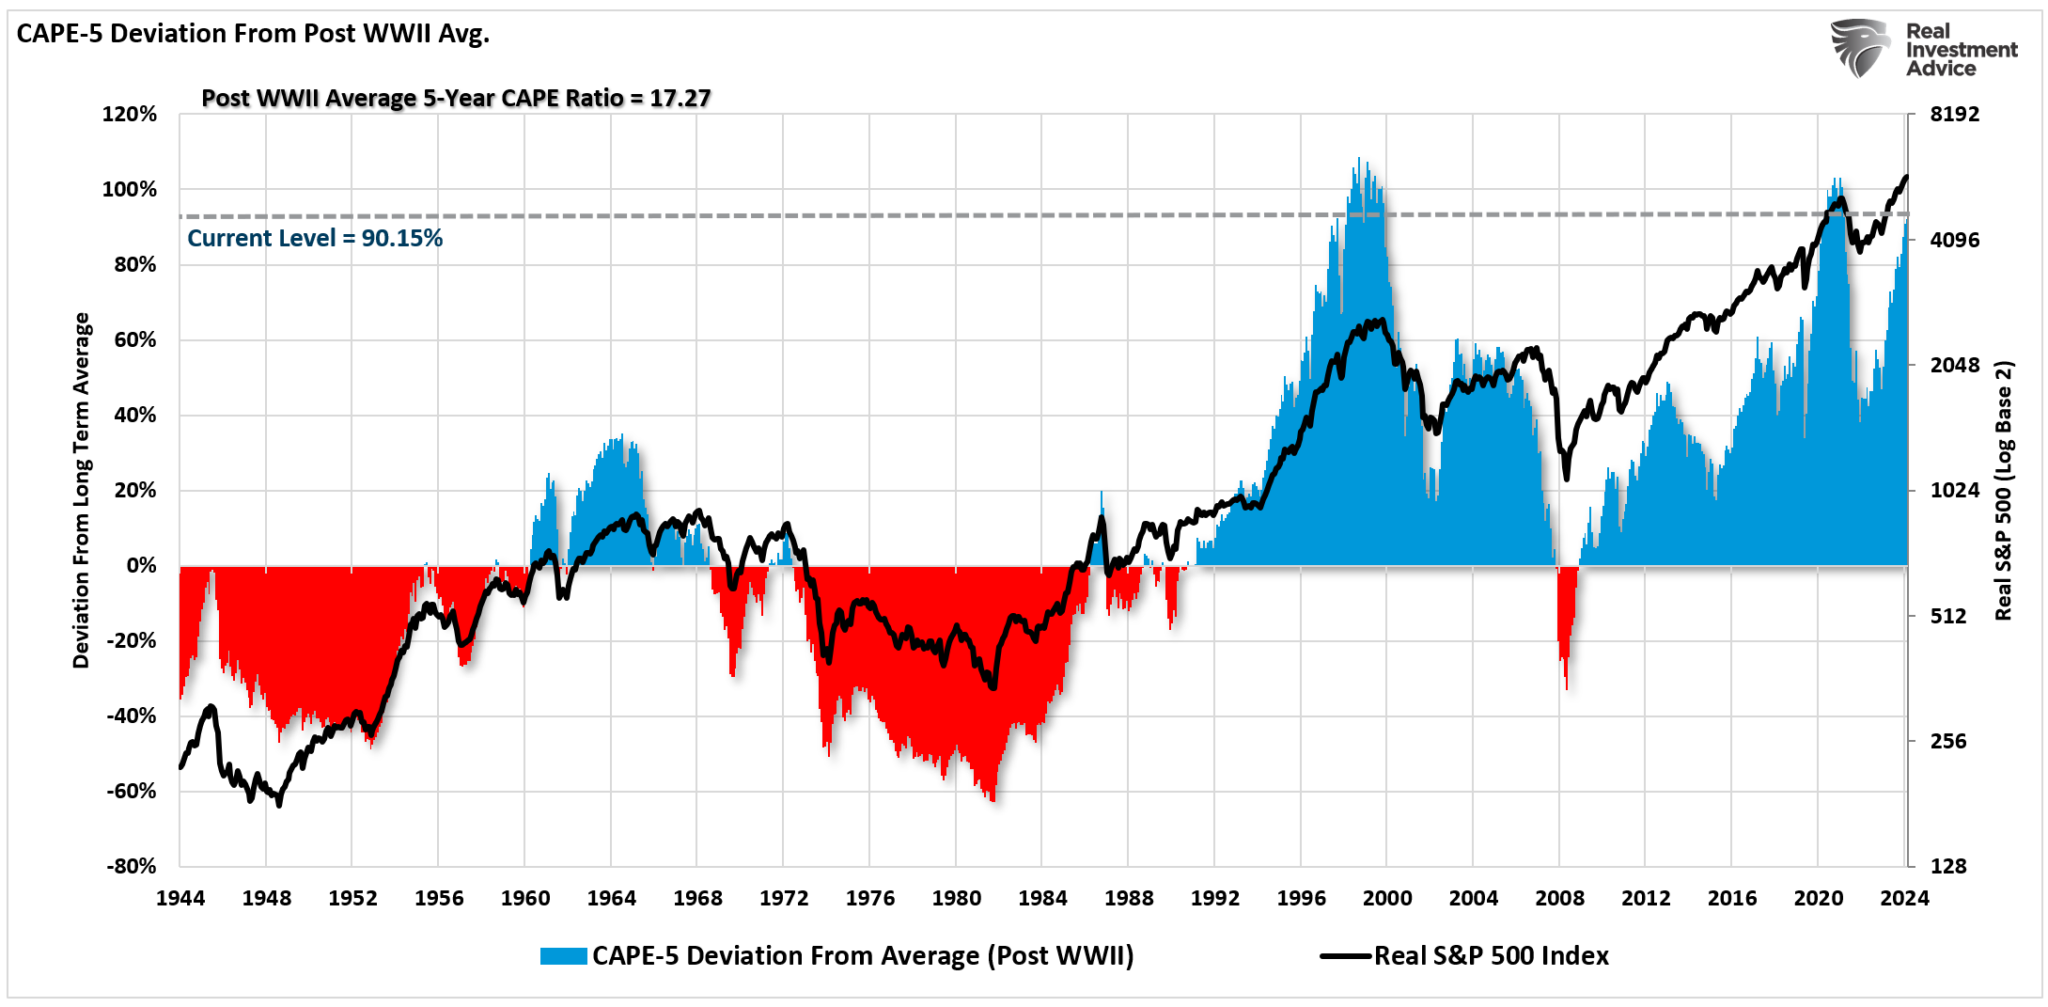
Is CAPE-5 a better measure than Shiller’s CAPE-10 ratio? Maybe, as it adjusts more quickly to a faster-moving marketplace.
However, I want to reiterate that neither Shiller’s CAPE-10 ratio nor the modified CAPE-5 ratio were ever meant to be “market timing” indicators.
Since valuations determine forward returns, the sole purpose is to denote periods that carry exceptionally high levels of investment risk and result in abysmal future returns.
Currently, valuation measures clearly warn that future market returns will be substantially lower than they have been over the past 15 years. Therefore, if you are expecting the markets to crank out 12% annualized returns over the next 10 years so that you can meet your retirement goals, it is likely that you will be very disappointed.
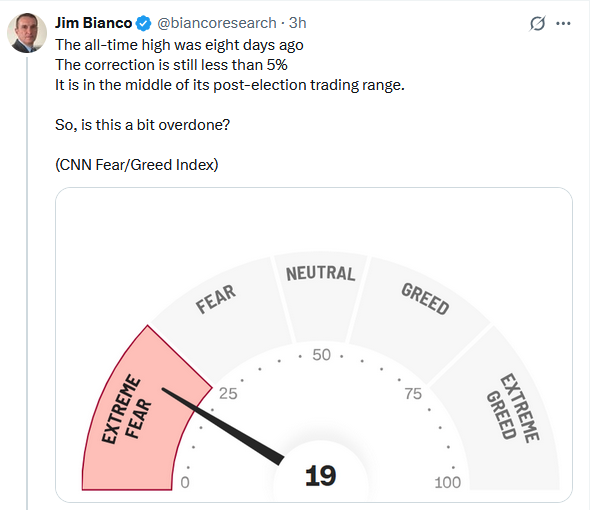
Tweet of the Day
“Want to achieve better long-term success in managing your portfolio? Here are our 15-trading rules for managing market risks.”
Related: Retail Investors Are Pulling Back—Should You Be Worried?