
Trending

We're starved for good long-term ideas. But the charts are about to give us a clue.
Yes, the starving chartist, that’s me. Because even in the midst of a giant rally in both stocks and bonds, I am still starved for long-term ideas. That is not because I’m the Grinch, masquerading as an investment strategist. It is because throughout most of the past 3 years, finding “trades” to do for gains over weeks or maybe a few months’ time has not been an issue. It never is, because when you follow 200 ETFs, something is always “in motion” and that can prompt high reward/risk tradeoffs worth “renting” in a trading account.
But when it comes to planting seeds and watching them grow (in investing terms), the ground has not been fertile. Finally in December there are some “green shoots” of potential emerging. But the past few years have been about different parts of the market setting up but then “failing” as they say in technical analysis…and on a few tests I took in college.
So as we wait for the market to tell us its story heading into 2024, here’s a quick look at a series of charts that lead me to a firm conclusion: there’s a lot of “what ifs” out there, but most of what I hear on financial television and read is assuming that the only way forward is up for stocks, and down for rates (and thus up for bond prices). So while that might end up being the case, and I’m ready for it…
I’m no fan of “ready-fire-aim” as an investment strategy
Here’s a quick set of charts, explained in something that sounds more like English than technical analysis lingo. Because that’s how we roll here at ETFYourself.com!
This is a chart of the average performance of the 1,000 largest US stocks. The S&P 500 and another 500, which covers the vast majority of the US stock market. That chart includes the dividend payments from those stocks. And yes, as is so often the case, “there’s an ETF for that” and the ticker symbol is EQAL.
Since May 7, 2021, the total return of the average stock among those 1,000 is about zero. Today’s strong rebound from yesterday’s late afternoon plunge has now made this index positive over the the last 31 1/2 months. So keep this in mind when investment sales people wax poetic about a new bull market, etc. There’s still a lot of proving to do.
|
|
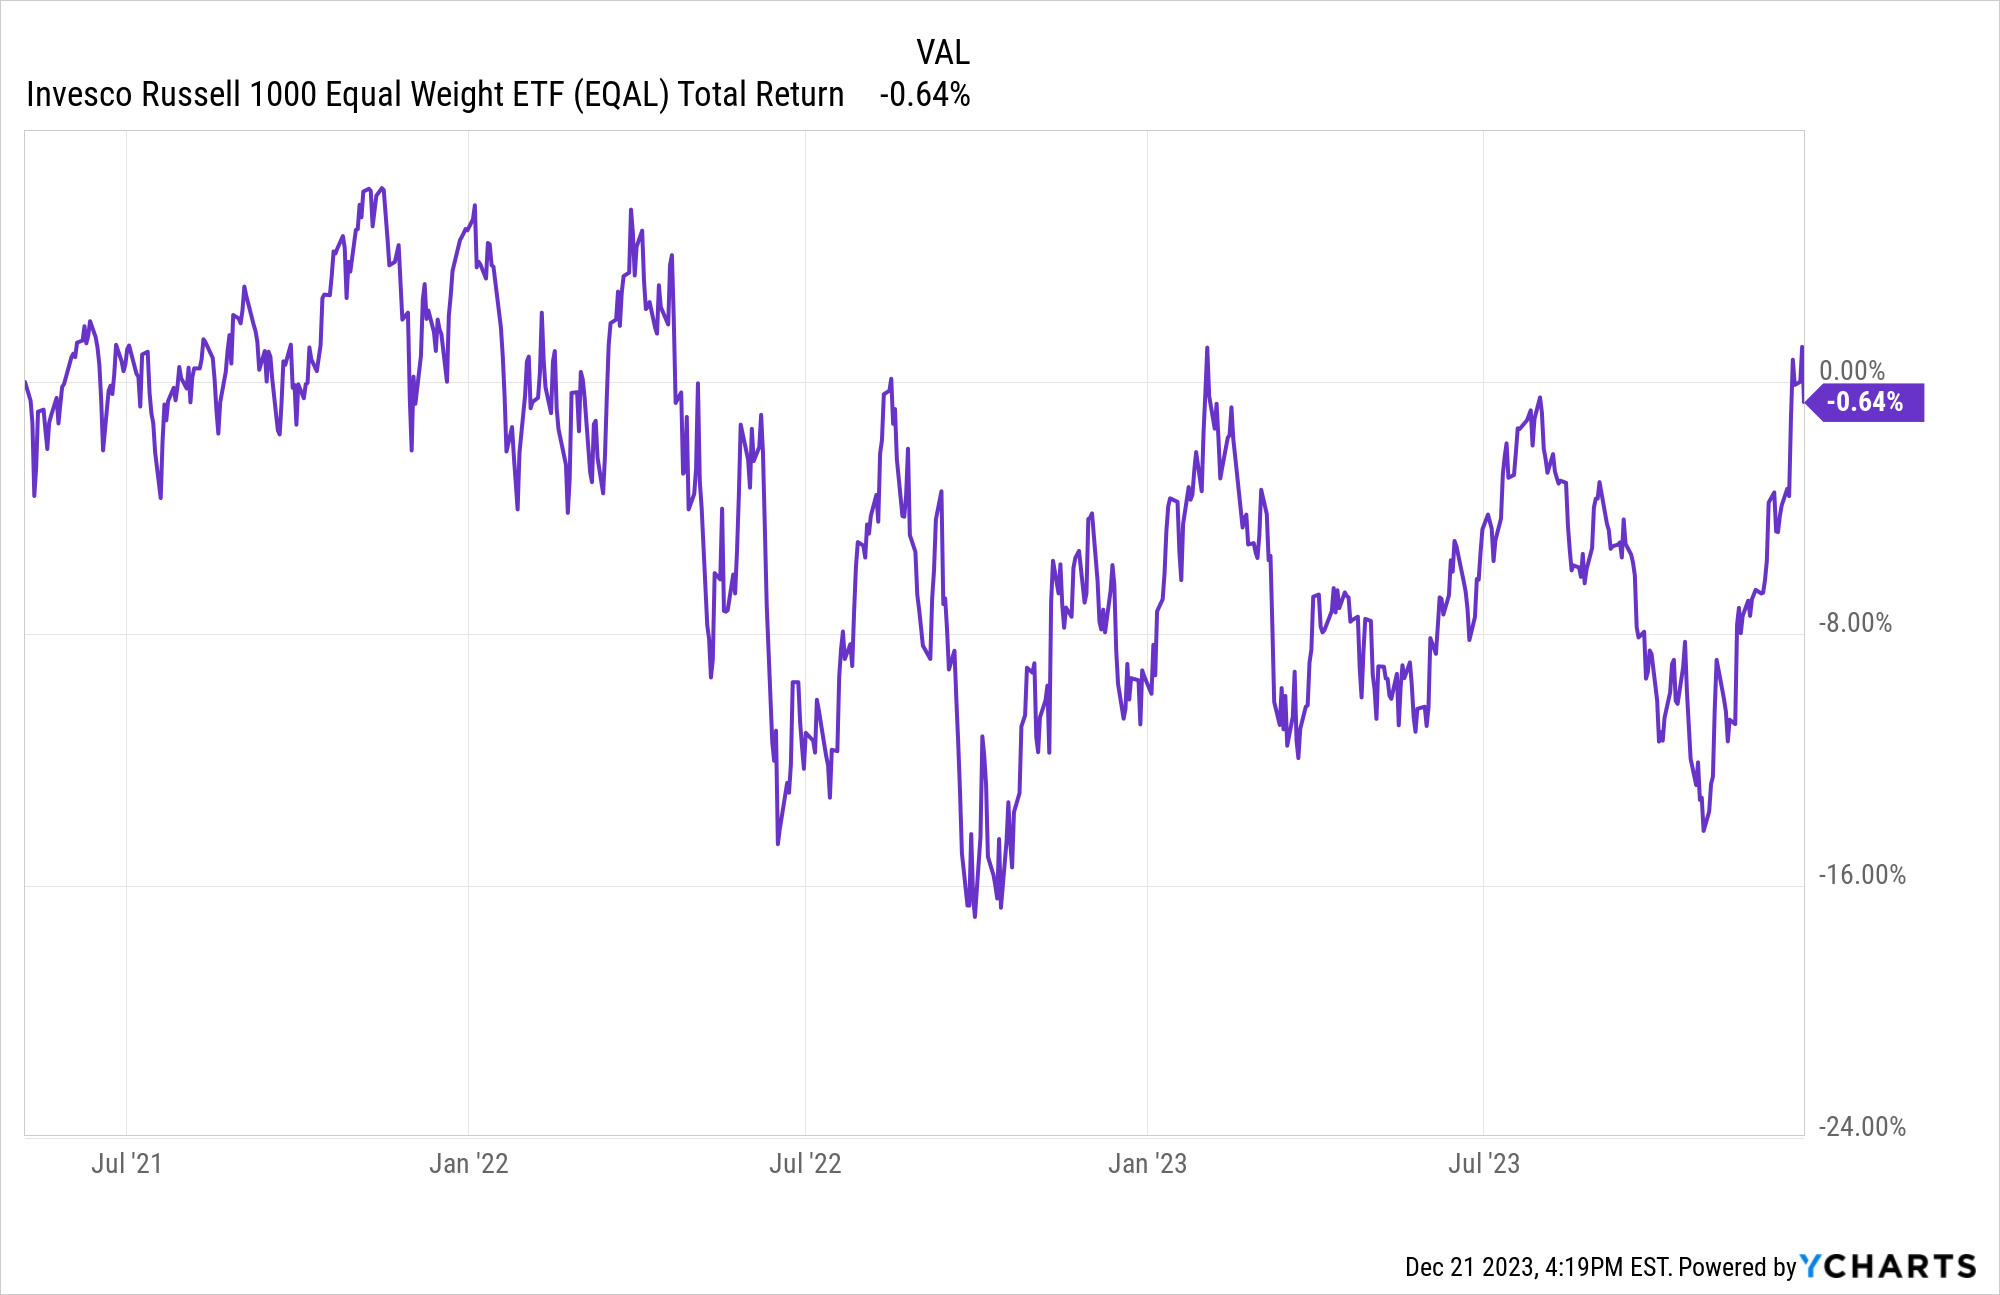
Also note in that chart above that buying into an investment like this back in May of 2001 would have left you looking at your account month after month, and except for some time at the start of the period, that account was under water. As I’ve written here over the past several weeks, this is either the early years of a long-term period of drek for stocks, or the extended pause that can allow a new, sustainable up market to get underway. But what I have a serious problem with is folks in my industry, all around me, cheerleading for one outcome or the other.
Pro tip: that’s driven by how they get compensated
The rest of the charts are the ones I like to scribble on (trend lines, key market decision points, etc.). They also cover a slightly shorter period of time than the first one.
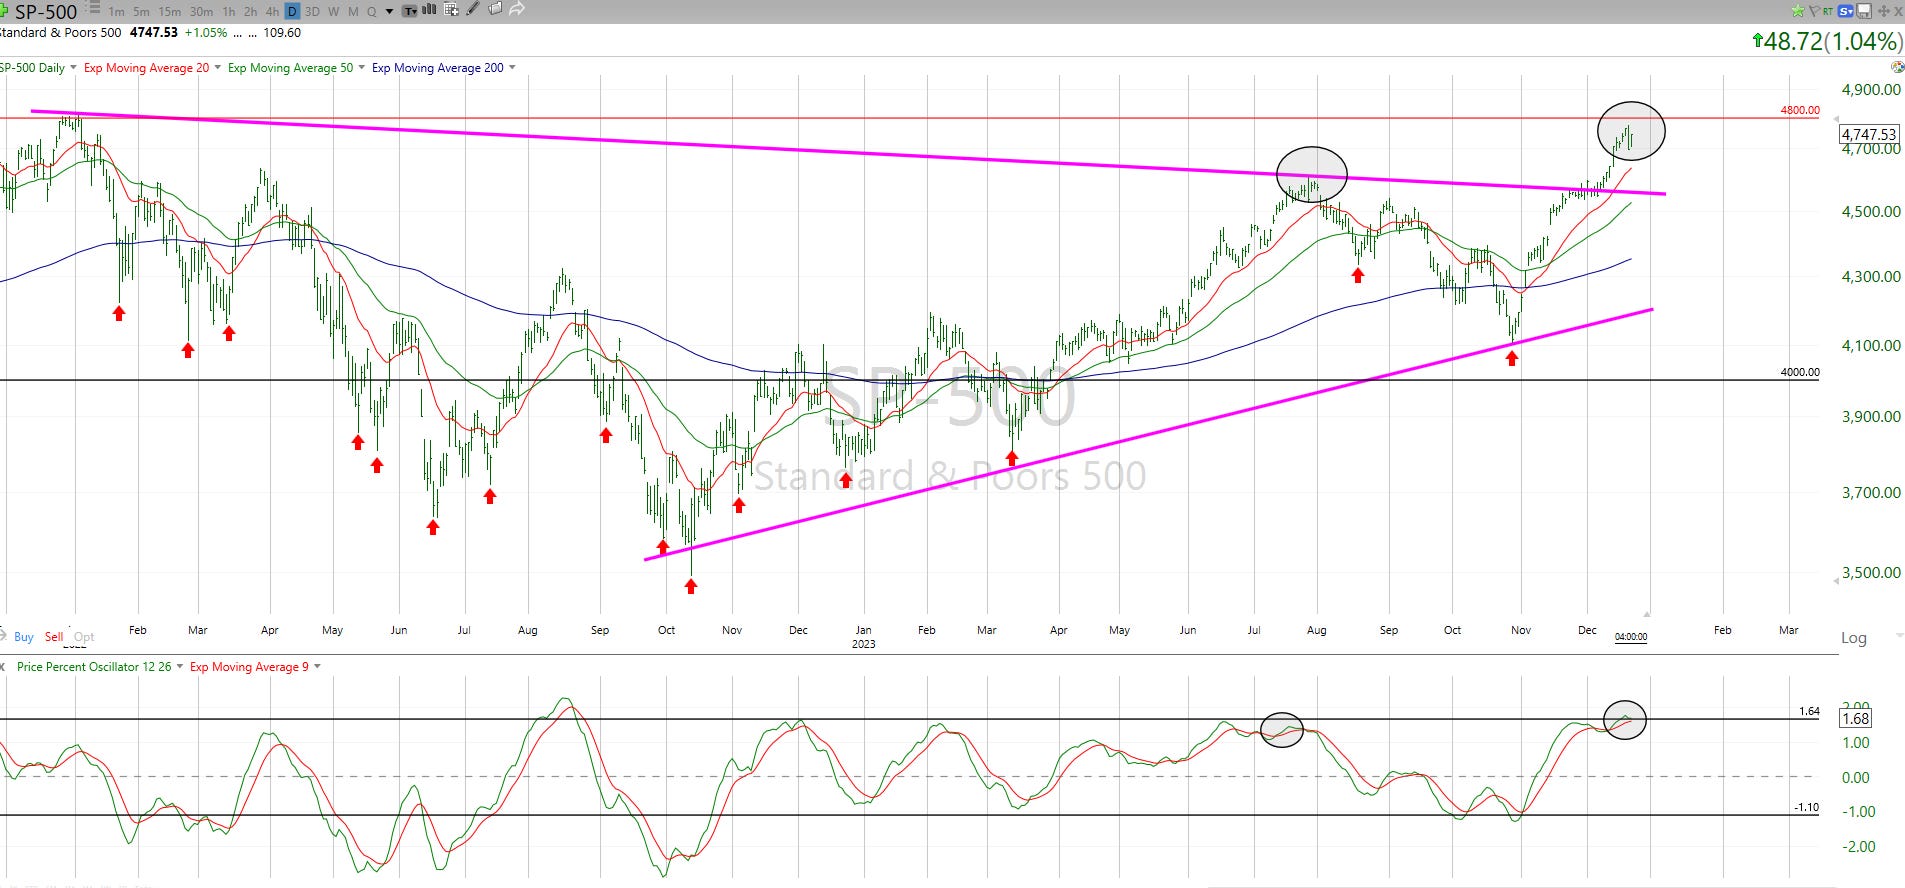
Next is the S&P 500. Simply put, it has successfully broken through some of the lower testing levels. But the longer it hangs around just below the 4,800 all time high level, the more risky things will get. Strong markets tend not to stall for very long. Instead, they make a lot of people jealous that they didn't get in sooner.
And, the lower part of the chart shows that momentum has surged to the same level it did the last time the market banged its head against the ceiling and fell to the ground. Let’s let this story play out before jacking up the ROAR Score any more than I already have (was 10, is now 35).
|
|
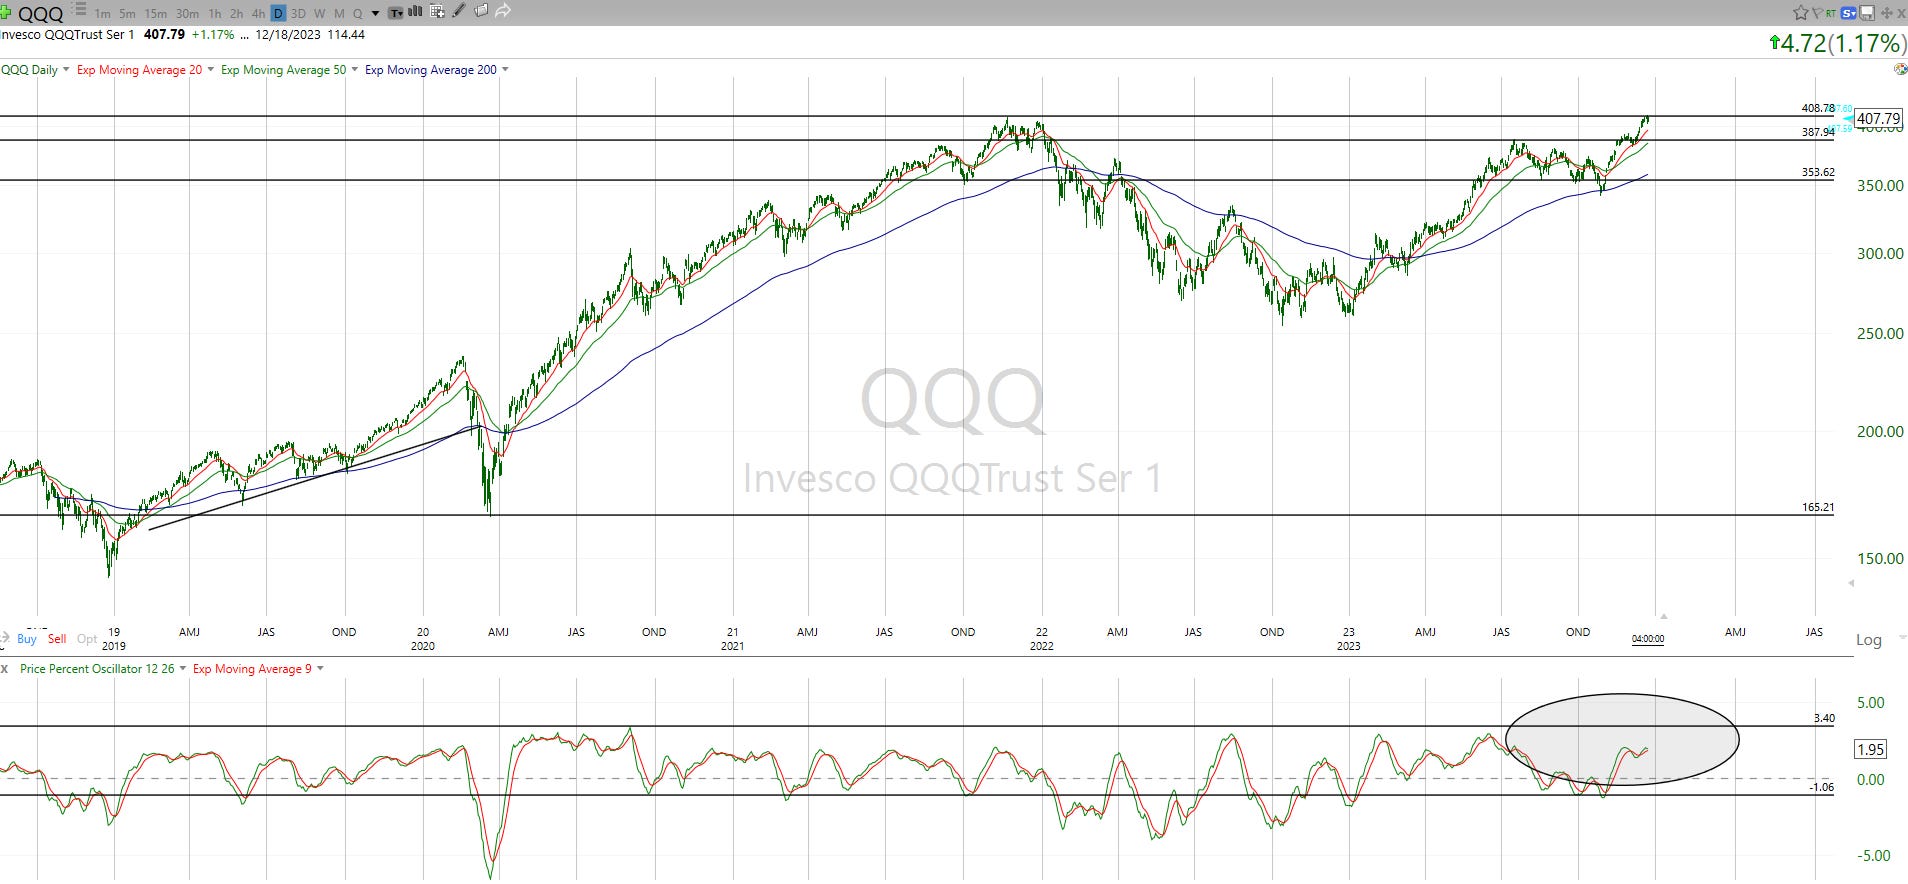
The Nasdaq (below) is in a similar spot, and I do think this is one to watch very carefully. This is where the leadership has been, and one of my early 2024 potential scenarios is the “2000-like” version. If that does play out, QQQ should vault higher fairly soon, and not look back until it peaks and begins a steady, slow motion crash.
Our approach is not about guessing. It is about sizing up multiple scenarios and then leaning/tilting/adjusting, not alternating between slamming on the breaks and “flooring it.”
|
|
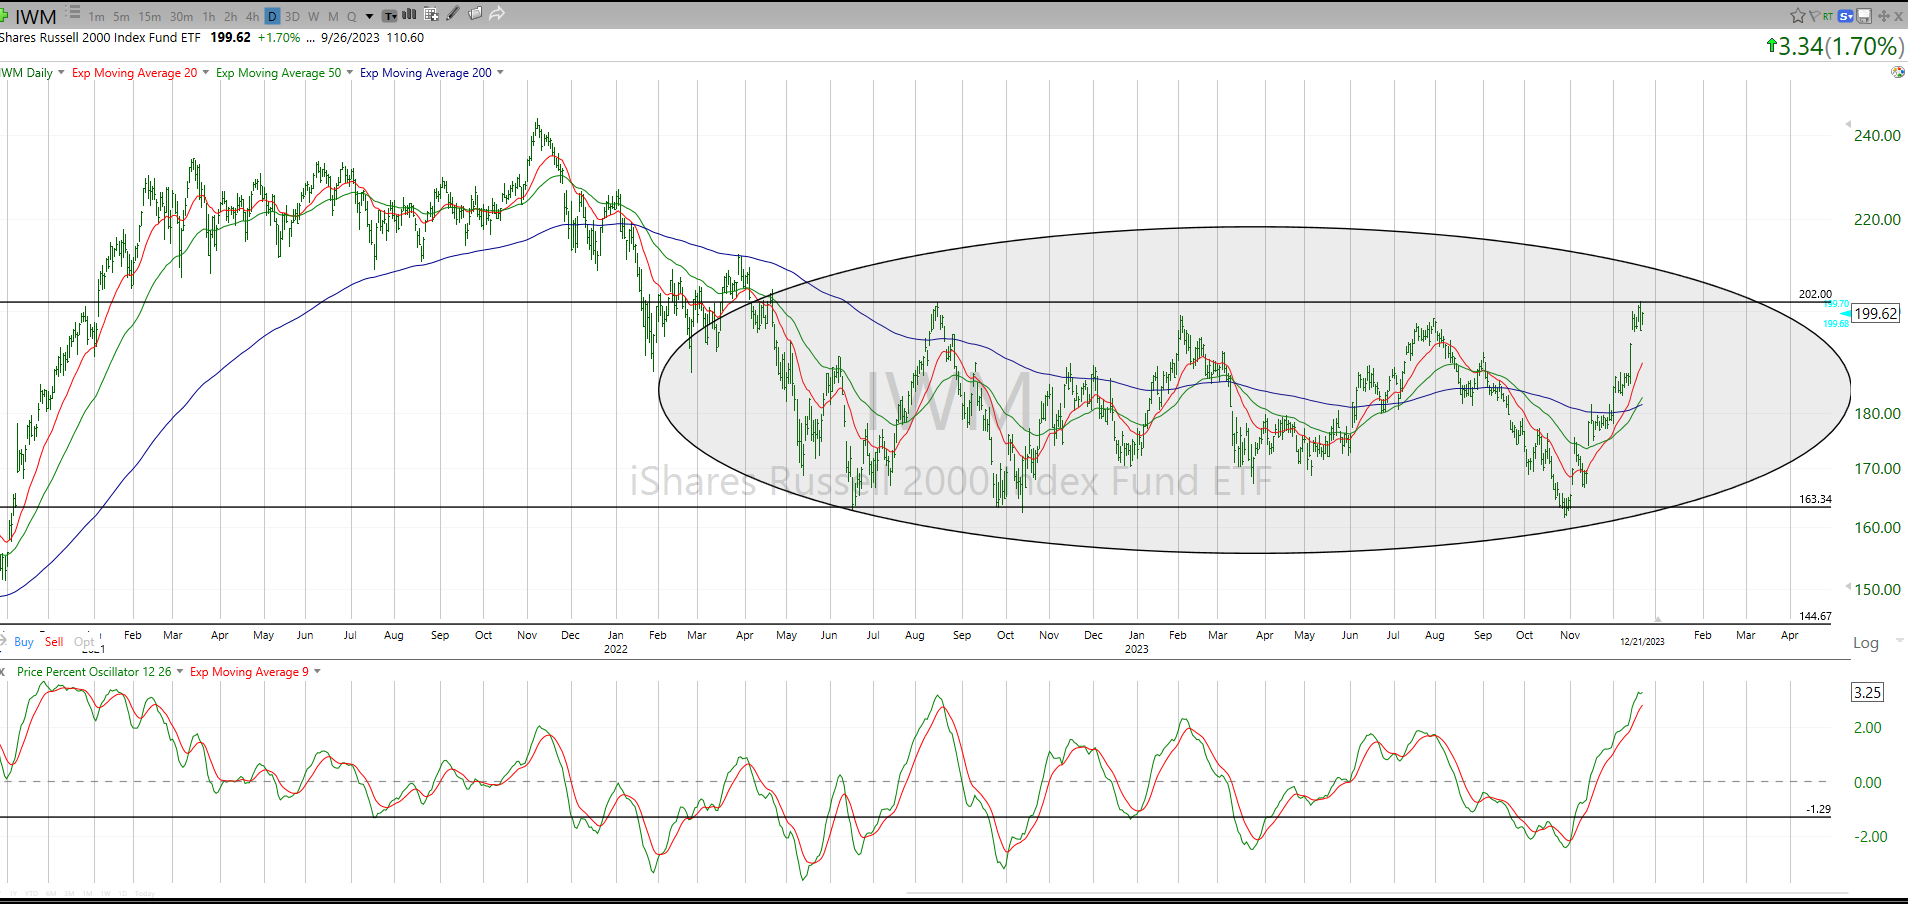
Next up (below) is IWM, a small cap stock indicator. The recent price rally, when we pull back the chart to look at a longer time frame, is really just hopping up and down in a range. A range that it now sits at the top of. So a firm breakout here would be a very good sign, and a rolling over from here would be a case of “the same old small cap misery” that investors have dealt with for a very long time. Grab the popcorn and let’s see what happens, and if it truly tells us anything “actionable.”
Oh, and the bottom of that recent (circled) range we’ve seen since spring 2022? That’s the same price ($163 a share) that IWM traded at back in May…of 2018! I wish I could tell small cap investors that IWM has paid a handsome dividend during that time, since this is a chart of price only. But alas, I can’t. It doesn’t yield much at all. Bah humbug!
|
|
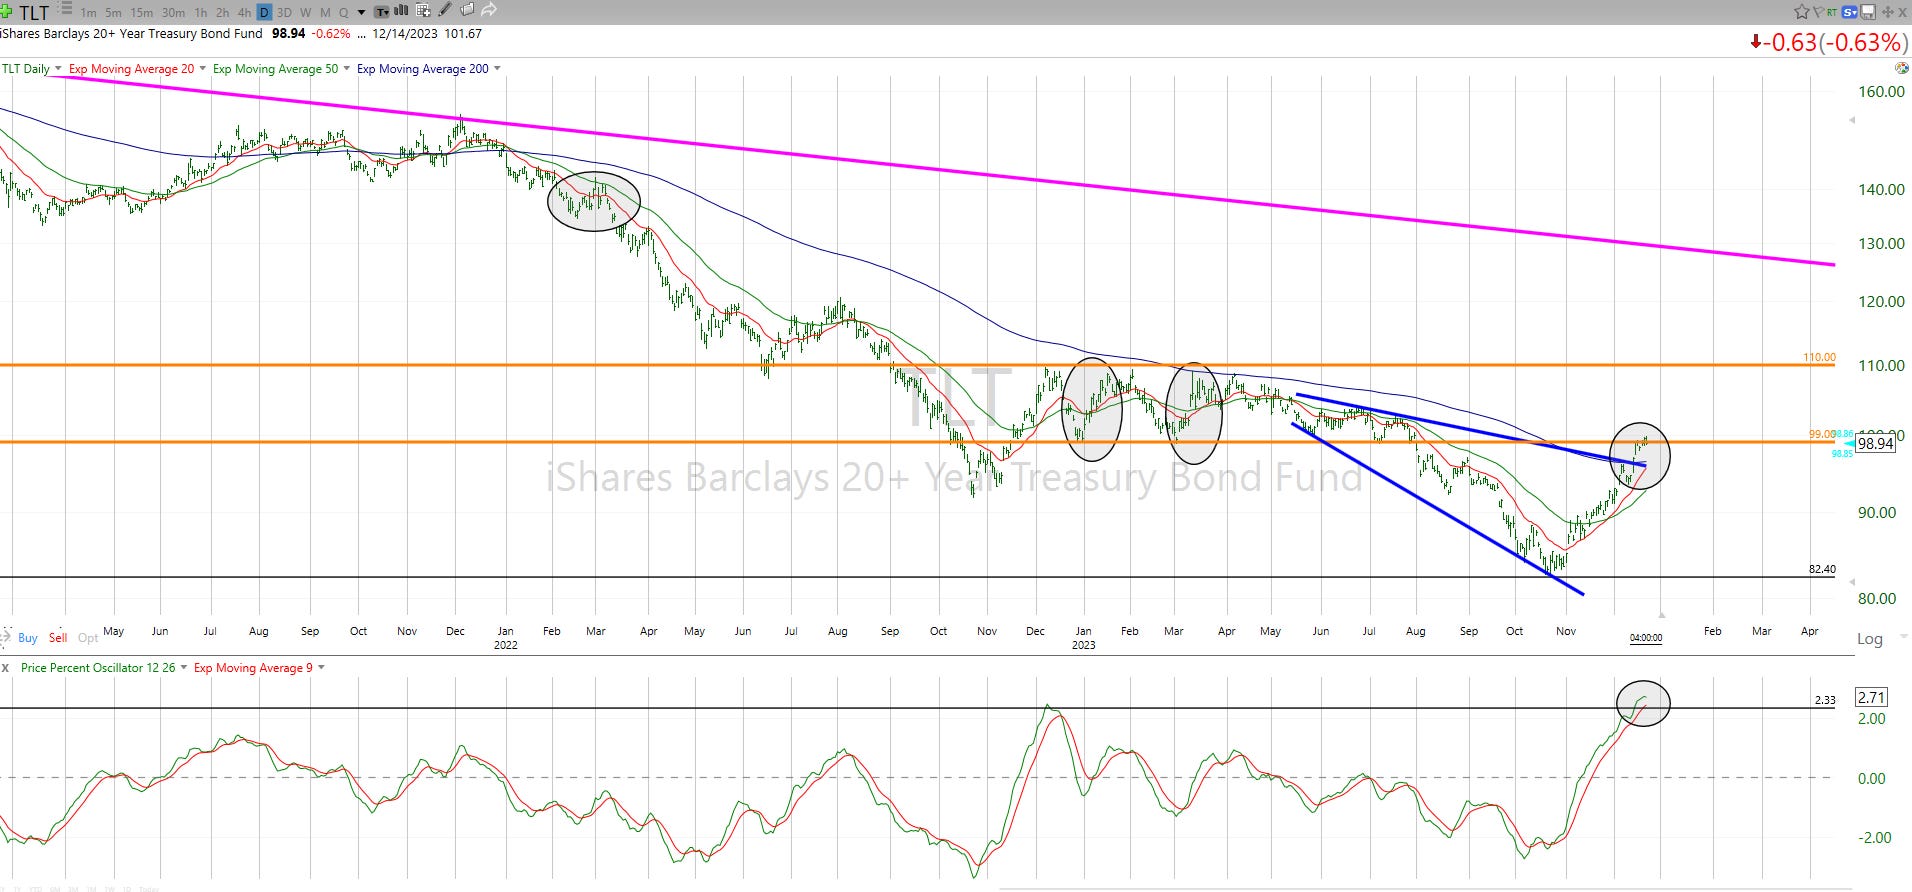
Lastly, here’s TLT, which invests in 20-30 year US Treasuries, but based on the attention it is getting, you’d think its dating Taylor Swift. :-)
TLT has rallied mightily, but see down below on the chart: toppy! It is a long way from really turning the corner, but the evidence that it can (and that long-term interest rates will continue to slide back down) is growing.
|
|
But here’s the risk-management issue for 2024, in 2 sentences: the Fed could lower rates and long-term bond and mortgage rates could crash downward. BUT, it could either be the much-heralded “soft landing” economy that does it, or that some part of the lag effect of all those rate cuts “breaks something” that speeds into a recession.
Either is on the table as 2024 approaches, and I’m not going to guess. I’m going to continue to do what I have done for 30 years: seek a balance between offense and defense, and always prioritize risk management, not speculation and greed.
That’s how to make money last: by putting it first!
Related: