You can thank the most profitable company in the world for the recovery in corporate profits. More importantly, with asset prices near record highs, just how much are investors willing to pay? Unsurprisingly, the answer is quite a lot, as per a recent CNN Money article:
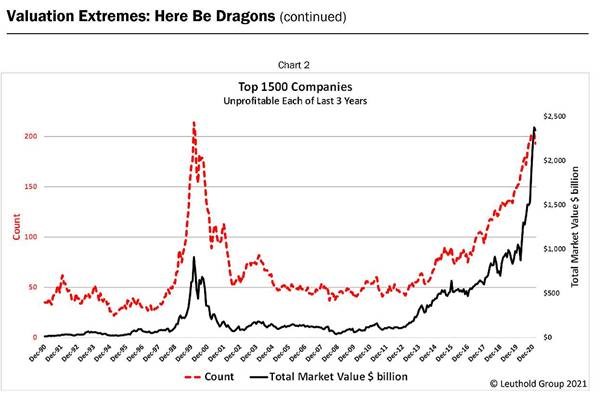
“Investors are pouring money into unprofitable companies more than any time since the dot-com bubble. This according to a recent report by Scott Opsal, director of research at The Leuthold Group.
Of the largest 1,500 companies by market capitalization today, around 200 weren’t profitable during any of the last three years. But instead of punishing them, investors have rewarded them with a total market value of more than $2.3 trillion. Wall Street hasn’t been willing to attach such high market values to unprofitable companies since the late 1990s. (Even then, the total market valuation of the unprofitable companies wasn’t even half of what it is now.) Of course, if you’re betting on a company becoming profitable in the future, you’re taking a risk.
“You’re going off to these uncharted regions where just about anything might happen,” Opsal says.”
Such isn’t the first time we have discussed this issue.
Profits Or GAAP Earnings?
In October 2019, we warned of the deviation of the stock market from corporate profitability. To wit:
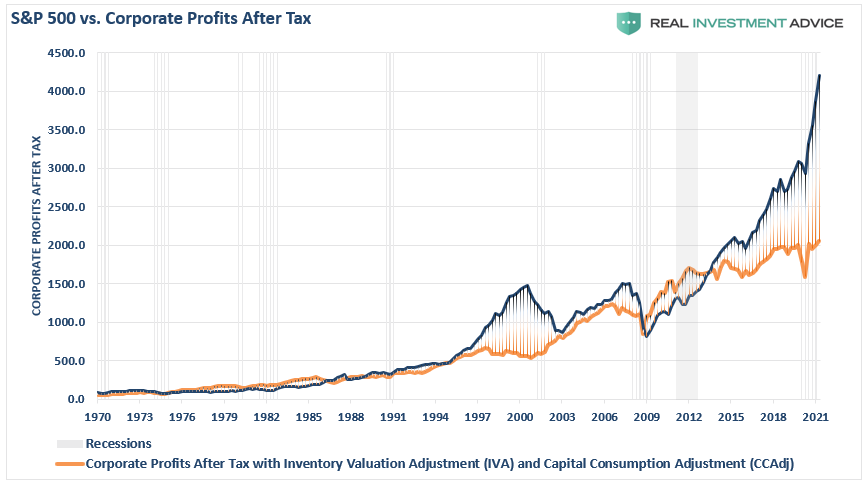
“If the economy is slowing down, revenue and corporate profit growth will decline also. However, it is this point which the ‘bulls’ should be paying attention to. Many are dismissing currently high valuations under the guise of ‘low interest rates,’ however, the one thing you should not dismiss, and cannot make an excuse for, is the massive deviation between the market and corporate profits after tax. The only other time in history the difference was this great was in 1999.”
Of course, in March, that gap began to close, but the Fed and Government’s massive interventions wound up exacerbating the issue. The updated chart from 2019 shows the problem.
The bigger problem is the gap between the market and GAAP (actual) earnings. It is improbable that earnings will catch up with the markets even with a jump in economic growth this year.
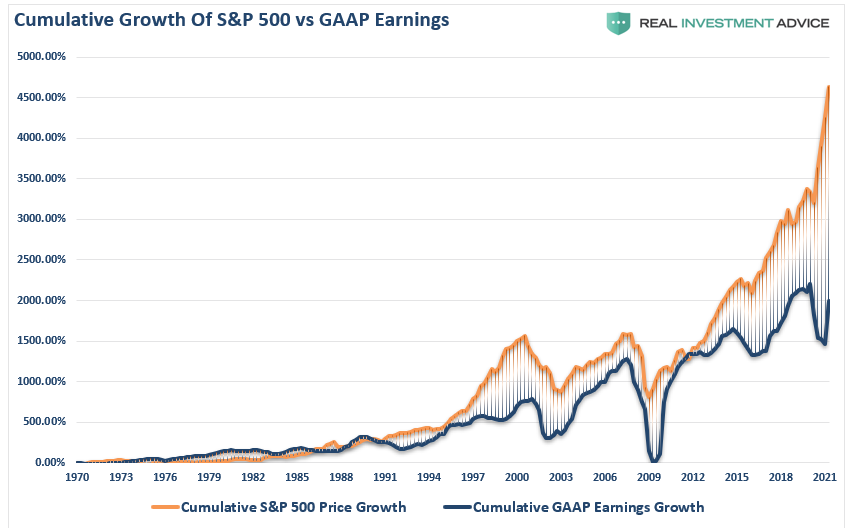
While GAAP earnings will indeed recover in 2021, they will be hard-pressed to justify current price levels. Furthermore, analyst’s estimates are always too optimistic which leaves much room for disappointment.
Debt Supported Profits
“A topic not raised in the article, but a frequent theme of ours is the role that share buybacks play in this bull market. Corporations remain the largest buyer of stocks over the last few years. However, share buybacks result in misleading earnings per share data, which warp valuations and makes stocks look cheaper.” – Michael Lebowitz
Over the last ten years, corporate debt issuance increased sharply to facilitate share buybacks. In doing so, earnings per share appeared to sustain a healthy upward trajectory. However, such was only because of reducing the ratio’s denominator (the number of shares) as debt on the balance sheet rises. This corporate shell game is one of the most prominent and egregious manifestations of the past decade’s imprudent Federal Reserve policies.
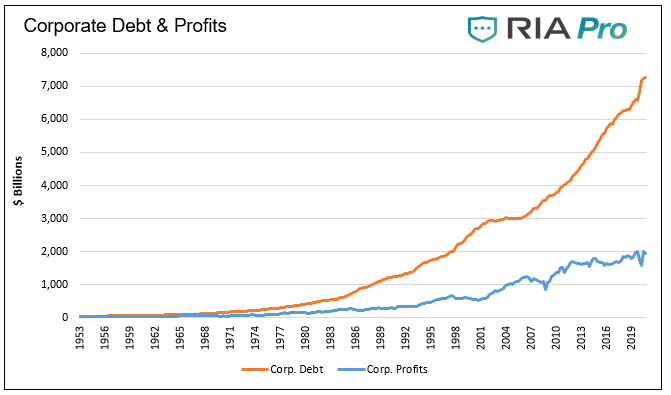
The growing divergence between debt and profits is a clear warning of the misuse of debt for non-productive purposes. If it were, profits would be rising in a manner commensurate, or greater, than the debt curve. We can also see the unproductive nature of corporate debt in the record levels of the corporate debt to GDP ratio. There is too much debt used for buybacks. Such continues to curtail capital investment, innovation, productivity, and ultimately profits.
Lot’s Of Manipulation
It isn’t just the deviation of asset prices from corporate profitability, but also reported earnings per share. As I discussed previously, the manipulation of operating and reported earnings per share by accounting gimmicks, share buybacks, and cost suppression is rather extreme. To wit:
“It should come as no surprise that companies manipulate bottom line earnings to win the quarterly ‘beat the estimate’ game. By utilizing ‘cookie-jar’ reserves, heavy use of accruals, and other accounting instruments they can mold earnings to expectations.
‘The tricks are well-known. A difficult quarter can be made easier by releasing reserves set aside for a rainy day. Or recognizing revenues before sales are made. A good quarter is often the time to hide a big ‘restructuring charge’ that would otherwise stand out like a sore thumb.
What is more surprising though is CFOs’ belief that these practices leave a significant mark on companies’ reported profits and losses. When asked about the magnitude of the earnings misrepresentation, the study’s respondents said it was around 10% of earnings per share.’“
As noted in “Easy Money,” stock buybacks just hit a new record.

Not surprisingly, the most prominent players in buybacks are the ones that need to subsidize their earnings the most to beat estimates; technology and financials.

It doesn’t matter how you look at it; investors are overly exuberant about future returns.
The Most Profitable Company In The World
So, who is the most profitable company in the world? You probably think the answer is: “Apple.”
However, you would be wrong.
The calculation of corporate profits includes an interesting company not widely recognized in most analyses. If you are an astute follower of our blog, you already know the answer.
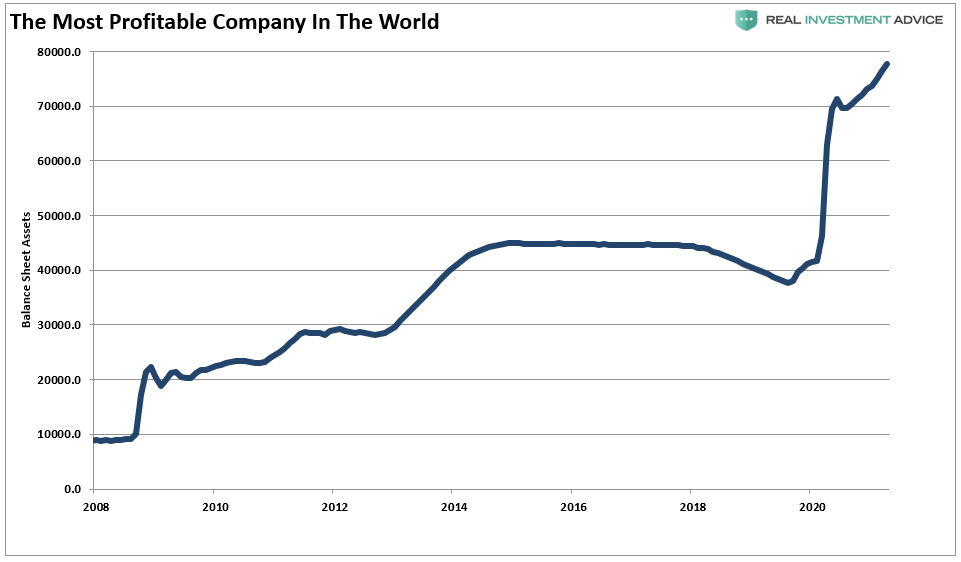
Yes, you guessed it (and it’s in the title). It’s the Federal Reserve.
When the Treasury Department pays interest on the debt, an expense to the U.S. Government, the Federal Reserve takes that in as “profits,” as reported on their balance sheet. At the end of the year, the Fed remits a portion of the “revenue” back to the Government.
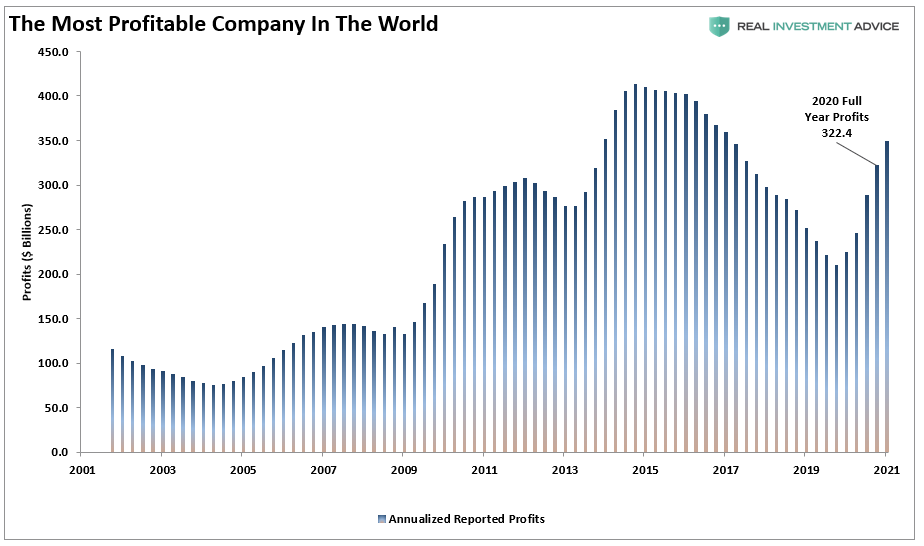
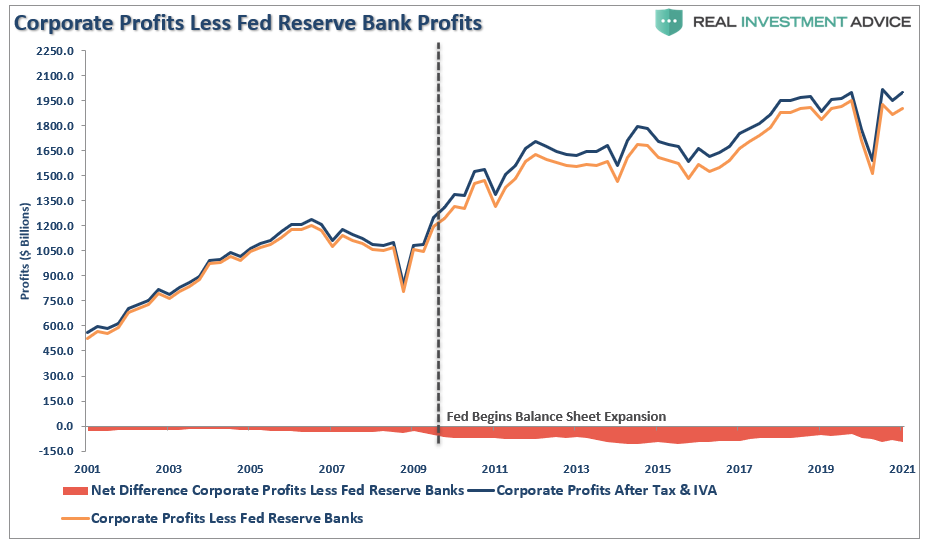
These “profits,” which are generated by the Federal Reserve’s balance sheet, are included in the NIPA measure of corporate profits. As shown, actual corporate profitability substantially weaker once you extract the Fed’s profits from the analysis.
To put this into perspective, in 2020, the Federal Reserve generated more income than Apple, Microsoft, JP Morgan, Facebook, McDonald’s, Coca-Cola, Walmart, Home Depot, Intel, Johnson & Johnson, Bank of America, Nike, Visa, Amazon, and Netflix – COMBINED.
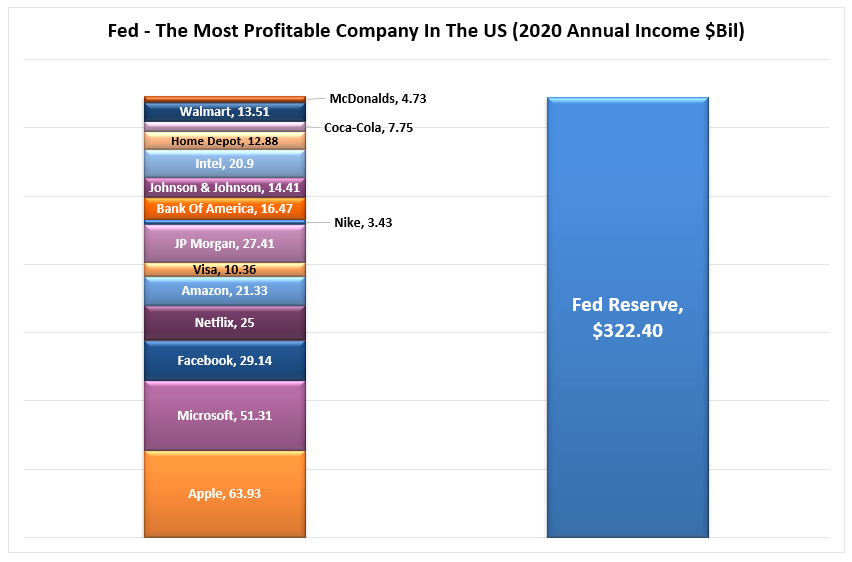
It’s pretty incredible.
Nonetheless, since the Fed’s balance sheet is part of the corporate profit calculation, we must include them in our analysis. While the media focus is on record operating profits, reported corporate profits are roughly at the same level are only slightly higher than they were in 2011. Yet, the market has been making consistent new highs during that same period.
A Guarantee Of Poor Returns
The detachment of the stock market from underlying profitability guarantees poor future outcomes for investors. But, as is always the case, the markets can certainly seem to “remain irrational longer than logic would predict,” but it never lasts indefinitely.
“Profit margins are probably the most mean-reverting series in finance, and if profit margins do not mean-revert, then something has gone badly wrong with capitalism. If high profits do not attract competition, there is something wrong with the system, and it is not functioning properly.” – Jeremy Grantham
When we look at inflation-adjusted profit margins as a percentage of inflation-adjusted GDP, we see a straightforward process of mean-reverting activity over time. Of course, those mean reverting events always occur coincident with recessions, crises, or bear markets.
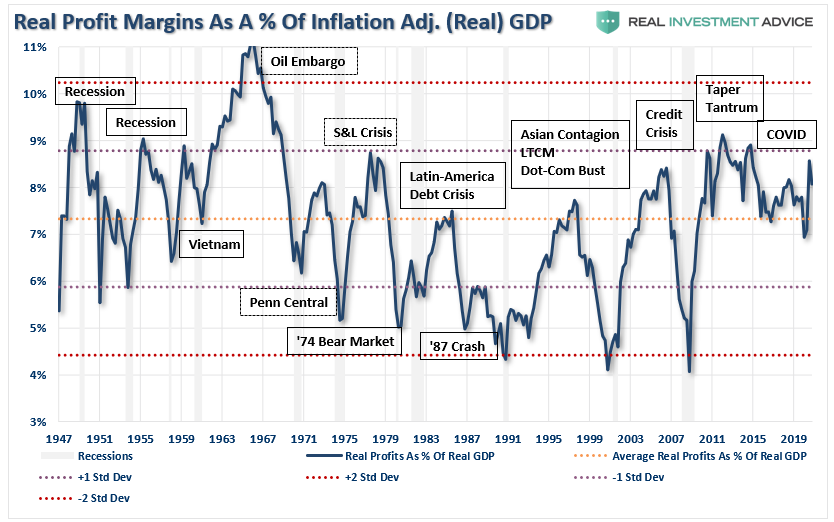
More importantly, corporate profit margins have physical constraints. Out of each dollar of revenue created, there are costs such as infrastructure, R&D, wages, etc. The biggest contributors to profit margins remain suppressing employment, wage growth, and artificially suppressed interest rates which significantly lower borrowing costs. Should either of the issues change in the future, the impact to profit margins will be significant.
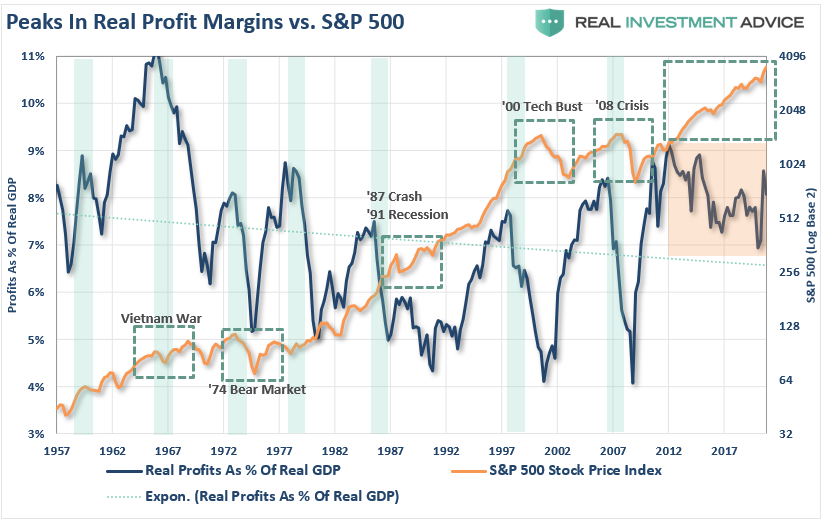
I have highlighted peaks in the profits-to-GDP ratio with the green vertical bars. As you can see, peaks, and subsequent reversions, in the ratio are a leading indicator of more severe corrections in the stock market over time. Such should not be surprising as asset prices should reflect underlying corporate profitability.
One rationalization is that low-interest rates, accounting rule changes, and debt-funded buybacks changed the game. While that statement is true, it is worth noting that each of those supports is artificial and finite.
No Real Help
While corporate profits are indeed improving, you can thank the Federal Reserves’ balance sheet for a large chunk of that improvement. Yes, the Fed is the most profitable company in the U.S. The problem is those profits are recycled back to the Treasury. As such, they don’t support real economic growth, employment, or wages.
This unsustainable credit-sourced boom led to artificially stimulated borrowing which pushed money into diminishing investment opportunities and widespread mal-investments. In 2007, we clearly saw it play out “real-time” in everything from sub-prime mortgages to derivative instruments which were only for the purpose of milking the system of every potential penny regardless of the apparent underlying risk. Today, we see it again in accelerated stock buybacks, low-quality debt issuance, debt-funded dividends, and speculative investments.
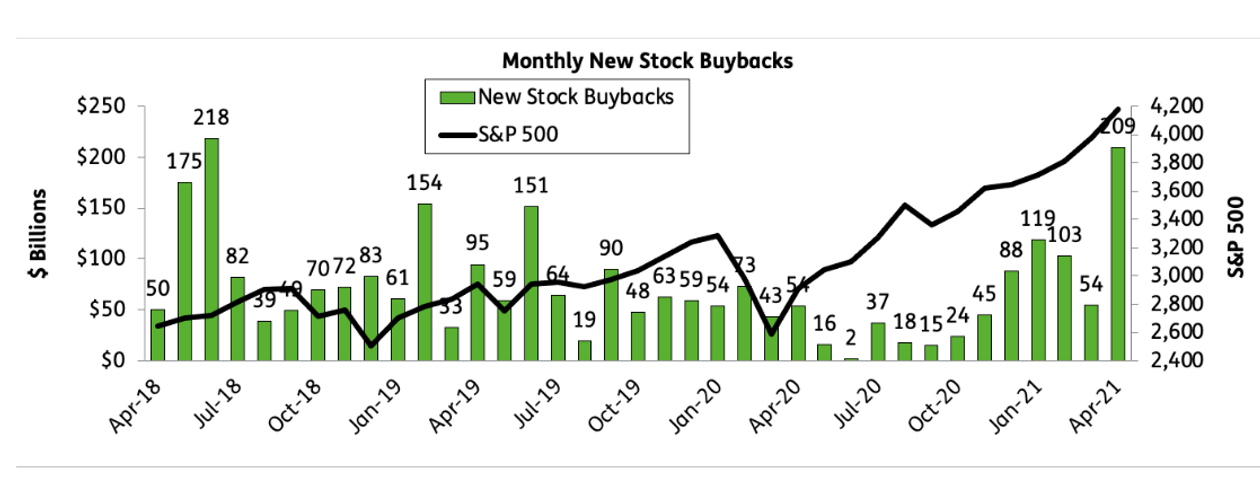
With rates rising, along with inflationary pressures through input pricing, corporate profitability is at substantial risk. It is unlikely that reported earnings growth will meet analyst’s current expectations. Downward revisions this year are highly likely. But, as long as the Fed remains active in supporting asset prices, the deviation between fundamentals and fantasy will likely continue to stretch extremes. Unfortunately, the result will be the same as it has always been.
While investor appetites for risk remain robust in the short term, history suggests that such “willful blindness” leads to terrible outcomes.


