Short positions in TLT, the popular 20-year US Treasury Bond ETF, have spiked to over 130 million shares, up from 107 million last month. TLT has 541 million shares outstanding. Consequently, the short interest has risen from 20% to 24% of the float. Furthermore, TLT’s days to cover ratio (short position/average trading volume) is nearly 3.5 days. As the graph below shows, that is far and away the most prominent short position in the ETF in at least the last 15 years.
So what does this tell us? For starters, it helps explain why bond yields have been trending higher. The narratives driving the bets for higher yields include inflation due to tariffs and disappointment over the current deficit spending proposals floating around Congress. However, while the narratives are concerning, the trade is extremely crowded. Furthermore, the narratives are based on expectations, not facts. Most large stocks and ETFs typically have short interest ratios of five or below. This extreme instance could set the stage for a significant short squeeze if yields fall, economic conditions weaken, or the narratives change.
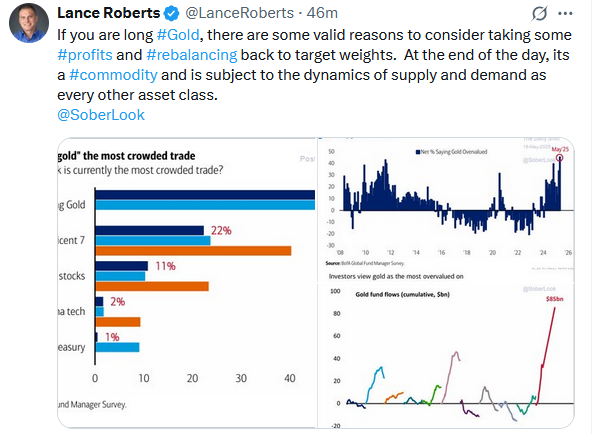
As the old saying goes, when everyone is on one side of the boat, move to the other. See the Tweet of the Day for another example of a crowded trade.

Market Trading Update
Last week, we discussed how the rally had repaired much of the previous damage following “Liberation Day.” However, we also made competing cases for the bulls and bears on the market’s next move.
“It is always difficult to say whether this is a ‘bear market’ rally while you are in the midst of it. In hindsight, these things are easy to identify, and investors have plenty of reasons to play the ‘could’ve, should’ve’ game. However, some valid arguments exist about why the recent correction was just that, and may now be over.”
This past week, the market continued its advance. There is little reason to be bearish with key overhead resistance levels broken. However, as shown, the markets are reaching decently overbought levels after being extremely oversold. This suggests that at least for now, the “easy money” has been made. With the market above the 200, and above the 50 and 20-DMA, pullbacks should be between 5600 and 5800. Investors can use such a pullback to increase portfolio equity exposures and reduce hedges accordingly. Conversely, 5000 to 5200 becomes the next critical target if those lower supports are violated. However, such would require some unexpected event to unfold.

Given the reduction in tariff-related risk and stable economic data, we suspect the market will hold bullish support. That statement follows our analysis from earlier this week, which discussed whether we have returned to a bull market or if this is still a bear market rally. That analysis compared the current market advance to the 2022 corrective cycle. However, that article elicited quite a few comments about why the recent “tariff” sell-off could be like the 2020 COVID-pandemic decline and recovery. It’s a fair question and worth a few words.
2020 vs 2025
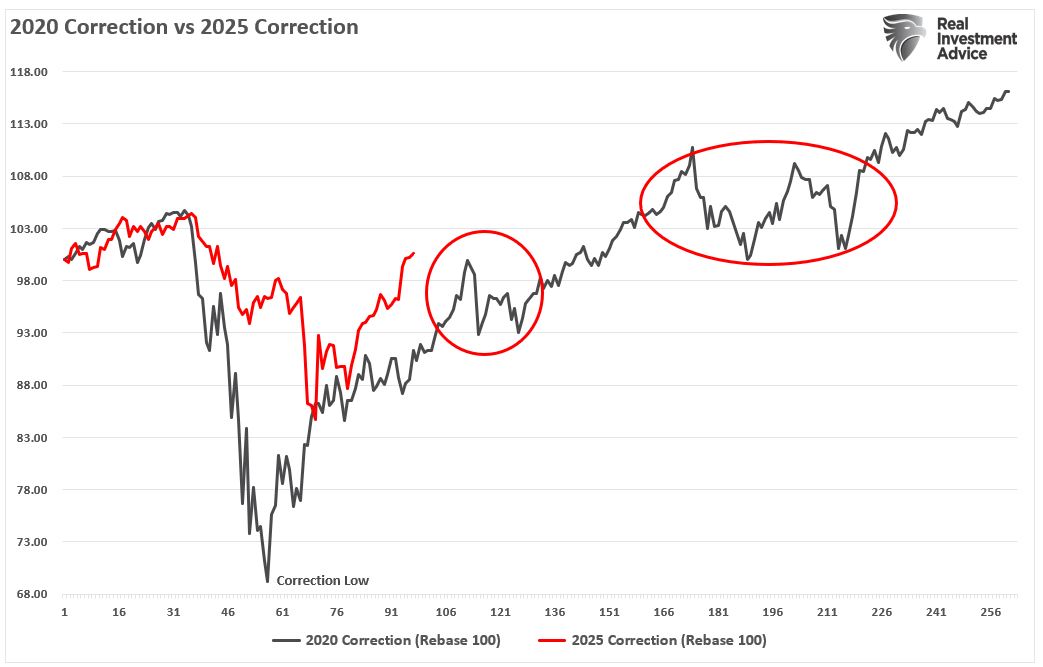
As shown, there is an analogy between the current market recovery and that seen in 2020 following the pandemic. However, it is worth remembering that there are many competing differences between the current macroeconomic backdrop and that of 2020.

However, as we discussed in that previous analysis, even a “can’t stop, won’t stop bull market” gives those who can be patient better risk/reward opportunities to increase equity exposures. For example, after the initial rally off the March 2020 lows, the market pulled back and consolidated briefly before rallying further. Then, another longer consolidation process that year provided another entry point for bullish investors.
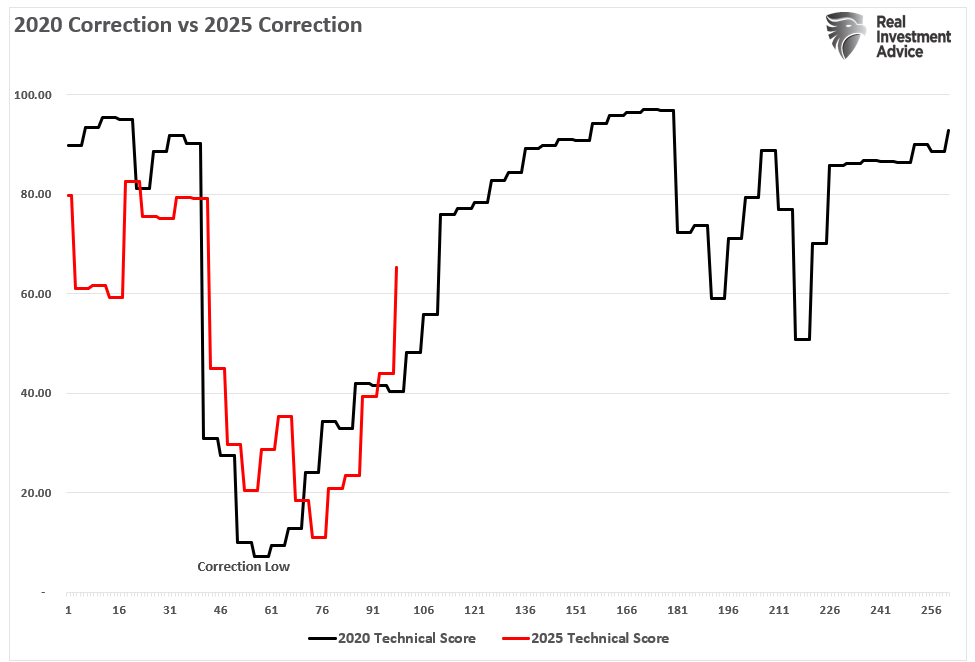
The weekly Technical Gauge we produce each week in this newsletter below follows the same path as 2020. While not yet back to bullish technical extremes, it is moving quickly higher to more elevated levels. When those readings reached 80, the market went through a longer consolidation process in 2020.
So, is this 2022 where the recent rally will fail and test lower levels? Maybe. Or, is it more like 2020, where the rally continues with only mild pullbacks along the way? Possibly. The true answer is that I don’t know. However, it is worth considering that there are many macroeconomic differences today compared to 2020. That lack of fiscal and monetary support, slowing economic growth, and tighter monetary policy are headwinds to higher stock prices. But, it is logical that the latest bullish market action has investors questioning a more cautious approach to the markets.
The same is true for us. We are currently underweight equities and hedged. However, the need for hedges is quickly declining, and the need for equity exposure is increasing. It’s a tough battle between creating portfolio performance and risk management. We are sticking with risk management until things become more certain, at least for now.
The Week Ahead
We get a break this week after a hectic week of economic data. With little data, investors are likely to focus on Fed speakers. In particular, has the recent round of inflation data eased their tariff-related inflationary concerns? Powell will speak on Sunday, May 25th. On Thursday, the release of the Chicago Fed National Activity Index (CFNAI), which comprises 84 indicators, will help us better assess the economy’s health. Thus far, as shown below, the index doesn’t signal that poor sentiment and tariffs are weighing on economic activity.
Corporate Stock Buybacks- Do They Affect Markets
As of May 2025, corporate stock buyback authorizations are on track to eclipse $1.35 trillion this year, with more than $1 trillion executed. This will exceed any other year in the market since the turn of the century. Such should be unsurprising with Apple (AAPL) announcing an additional $100 billion and Google adding another $70 billion to their programs (those two programs will account for 12% of the total alone).

The data should lead one to question why corporate stock buybacks have grown steadily since the turn of the century. Such is particularly the case when the overreliance on buybacks at non-accretive valuations to boost stock prices has become commonplace. Such a statement undermines the fallacy that corporate stock buybacks are solely a return of capital to shareholders. For example, Apple’s $110 billion buyback plan in 2024 raised questions among some investors about whether the company focused too much on immediate stock price increases rather than on investments that could drive long-term value. That statement should not be overlooked, given that 5-year annualized revenue growth has been flat since 2018. (Chart courtesy of SimpleVisor.com)

Tweet of the Day
“Want to achieve better long-term success in managing your portfolio? Here are our 15-trading rules for managing market risks.”
Related: Why Bank Regulators Are Quietly Backing the U.S. Treasury