
Trending


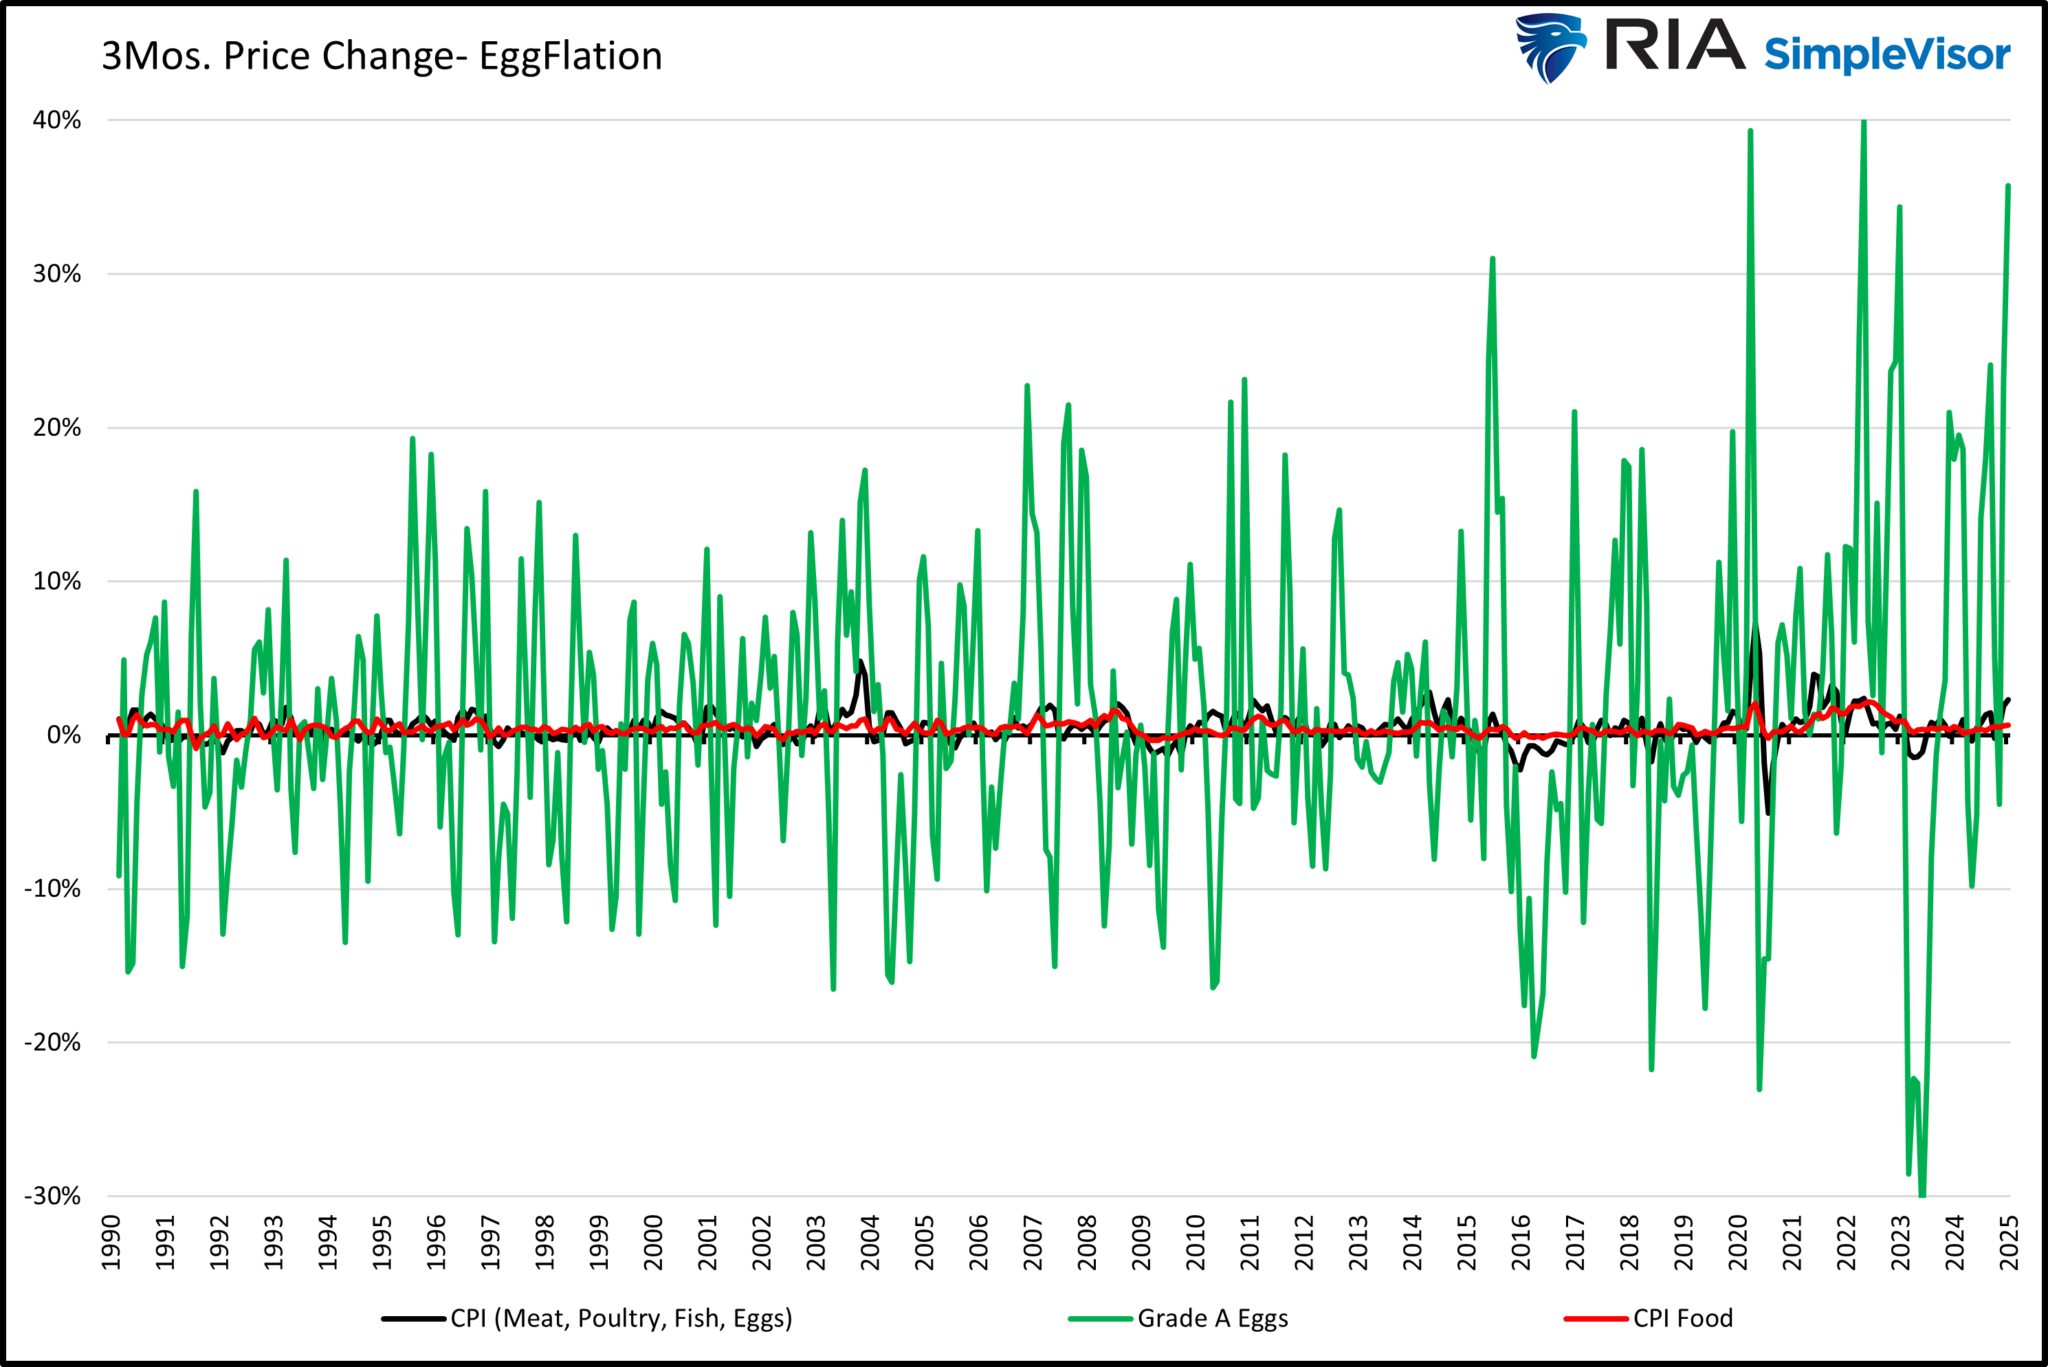
Egg prices were up nearly 19.5% in last Wednesday’s CPI report as the Avian flu wreaks havoc on the nation’s egg supply. Despite its inconsequential role in determining inflation, Eggflation is getting much publicity. Given the Eggflation fearmongering on social media, it’s worth putting some context on egg prices and their impact on CPI.
Eggs fall under the broad category of food prices, accounting for 13.7% of CPI. Within the Food category is a subcategory called meats, poultry, fish, and eggs. This group contributes 1.6% of CPI. Drill down one more layer, and eggs account for .17% of CPI. While eggs only account for a mere .17% of CPI, other products made with eggs are impacted, but this can’t be quantified with the CPI data. However, the contribution of higher egg prices to the CPI figure directly and indirectly is tiny.
Our Eggflation graph below charts the three-month price changes for eggs and the two aforementioned CPI food categories. Egg prices are historically highly volatile. However, their impact is minimal due to their low contribution. Moreover, the recent 35% increase in egg prices over the past three months is high but not extreme. Since 2020, there have been three other similar instances. In 2015, prices rose about 30% over three months due to the bird flu. For those of us who eat eggs regularly, Egglfation is annoying. However, from a macro-inflation perspective, Eggflation is not worth worrying about.
What To Watch
Earnings
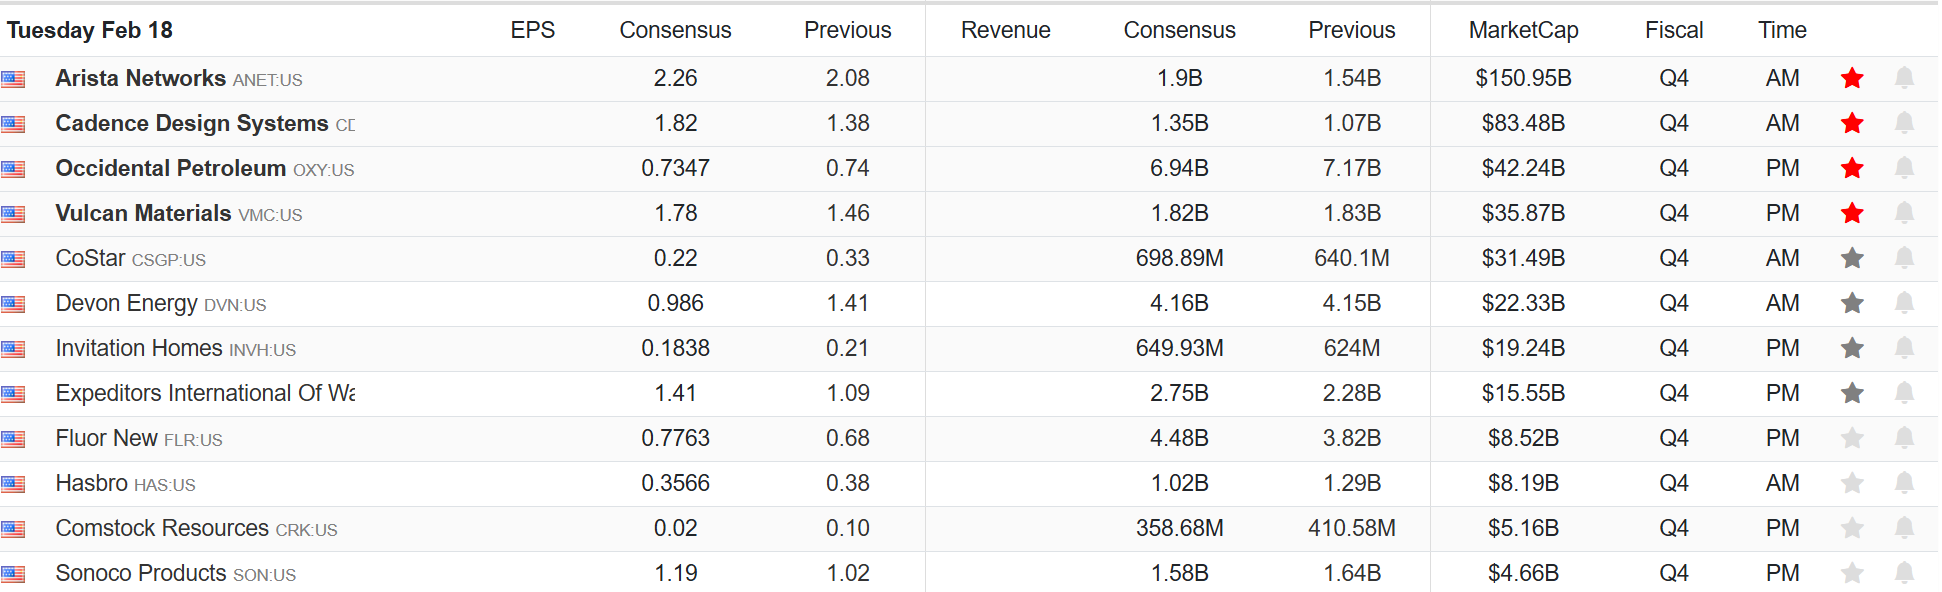
Economy
![]()
Market Trading Update
The market was closed yesterday for Presidents Day. However, on Friday, I discussed how the market responded positively to the latest inflation prints, along with bonds rallying decently. Most noteworthy, we continue to see a sharp increase in money flows into the market despite tariff announcements and somewhat strong inflation reports.
However, on Thursday, the market broke out of the bullish consolidation over the last few weeks, successfully retesting and holding support at the 50-DMA. Notably, the bullish trend remains intact, and retail investors continue to pour money into the market, with money flows reaching typical peak levels. With the market elevated, downside risk over the next few weeks will likely be contained to recent January lows. What would cause such a correction is unknown, but if money flows begin to reverse, such will likely provide the evidence needed to rebalance risks accordingly.
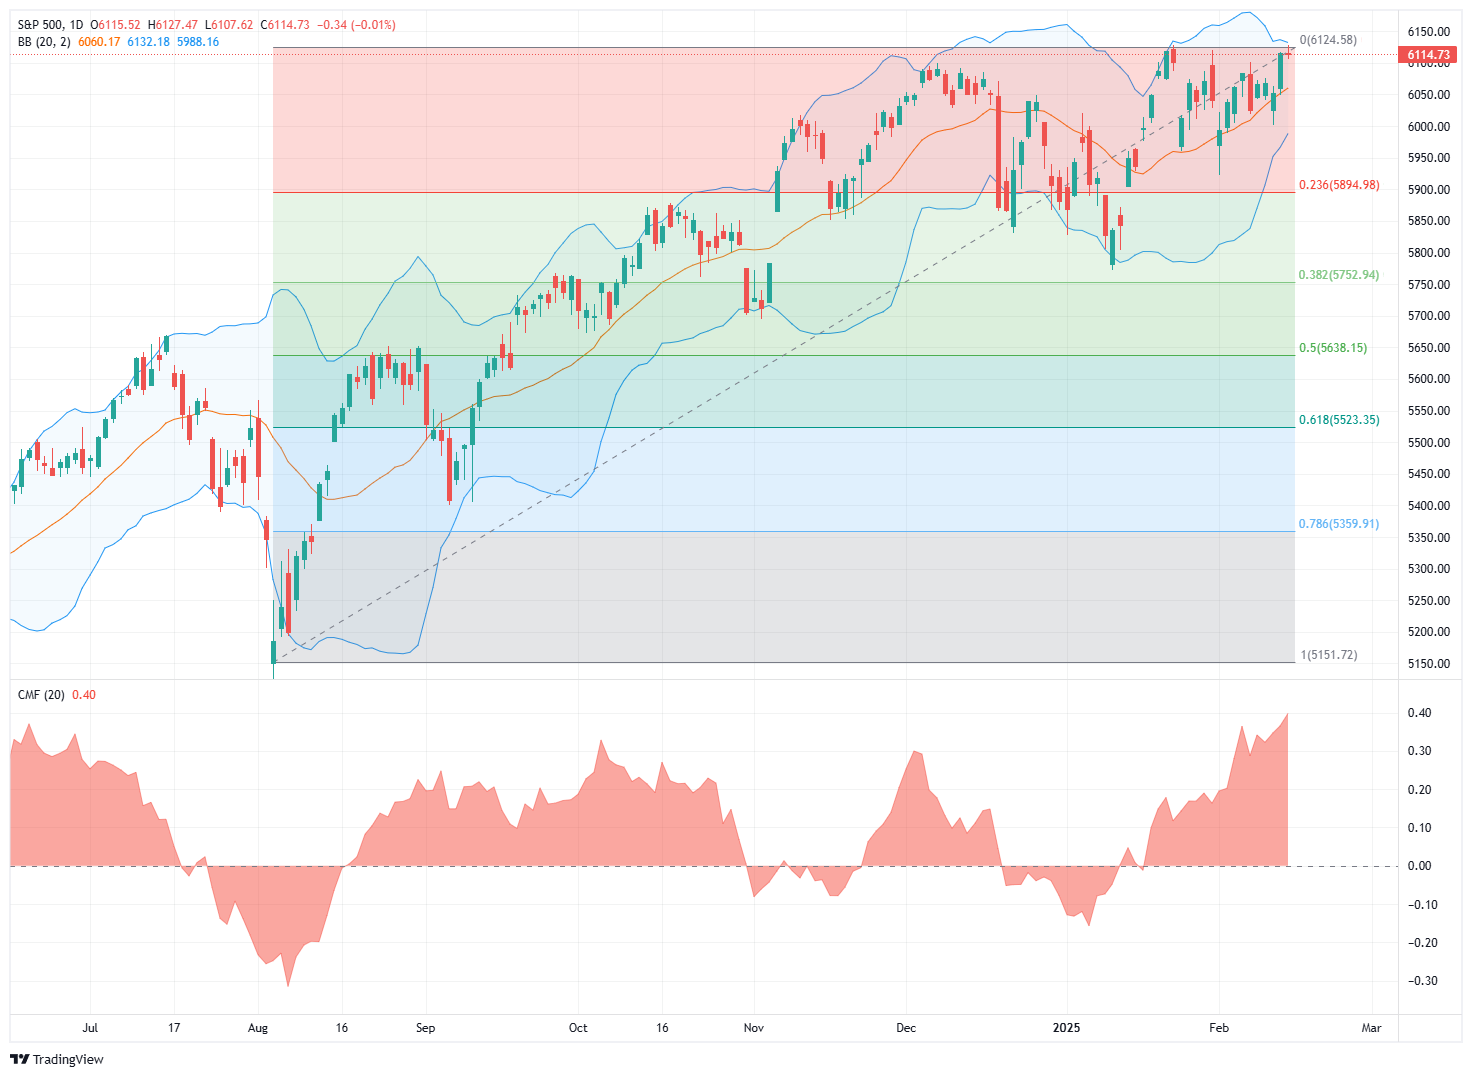
The bullish bias is evident, as witnessed by the recent surge in retail money flows into leveraged ETFs and speculative options trading. However, as is always the case, whenever investors are crowded on “one side of the boat,” it is often a decent contrarian signal to be a bit more cautious. Furthermore, while there is currently no evidence of a catalyst for a correction, it is worth noting that we are entering into the seasonally weak part of February.

While this is the average of daily market returns, it does not guarantee that market weakness will present itself. But it is worth being aware of the potential possibility of such a development.
Speaking of excess, Sentiment Trader recently did a great piece on the market’s Sharpe ratio. The conclusion of their report is worth considering.
“When the going gets easy for investors, it’s natural to let one’s guard down and become complacent. That’s a dangerous condition for all but the longest-term, long-term, unleveraged investors. Markets can be their most dangerous when they look the safest.
Using the Sharpe ratio as a proxy for how good it’s been for U.S. investors, we see above that there aren’t many times in history when it’s been better than the past six months, and there are signs that it’s ending. That can mean more volatility, but it doesn’t necessarily mean negative returns. The biggest takeaway has been moderate returns, with much more of a two-way market than investors had gotten used to in the months prior.”
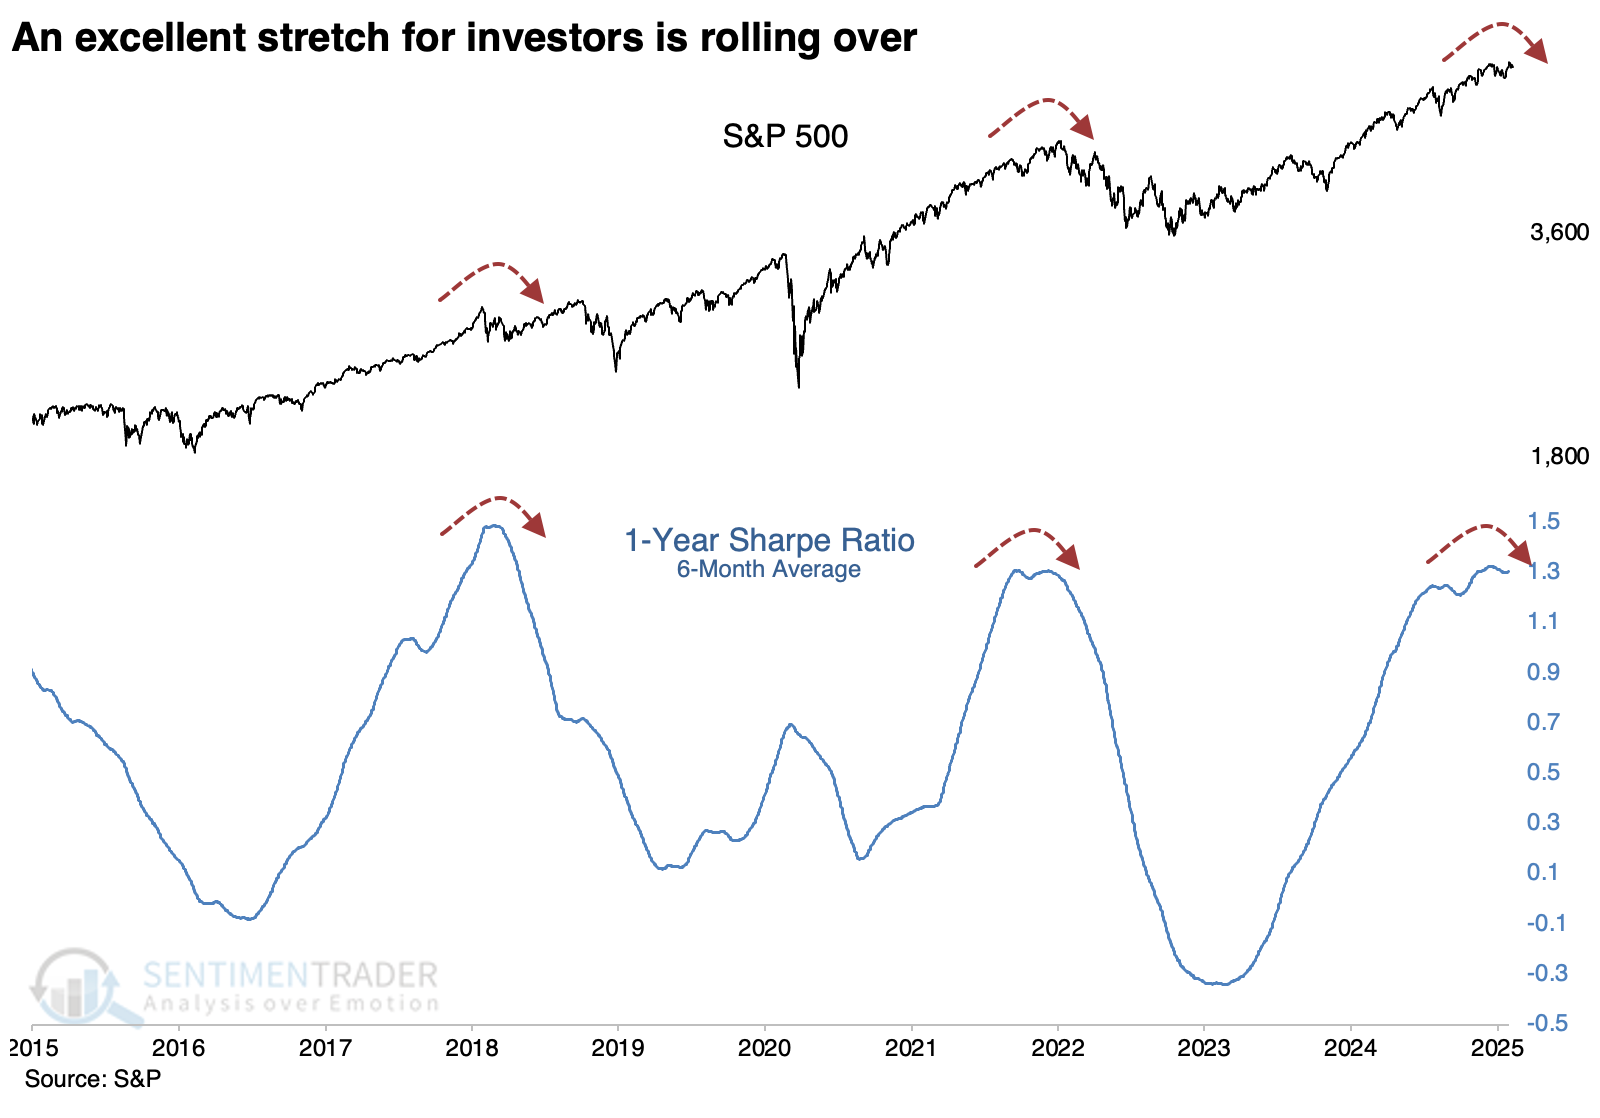
An extended period of speculative complacency in the markets has markedly increased the Sharpe ratio. The problem is that long periods of complacency, a function of price stability, are often followed by periods of instability. We suggest managing risk now, even though the bull market remains entrenched.
The Week Ahead
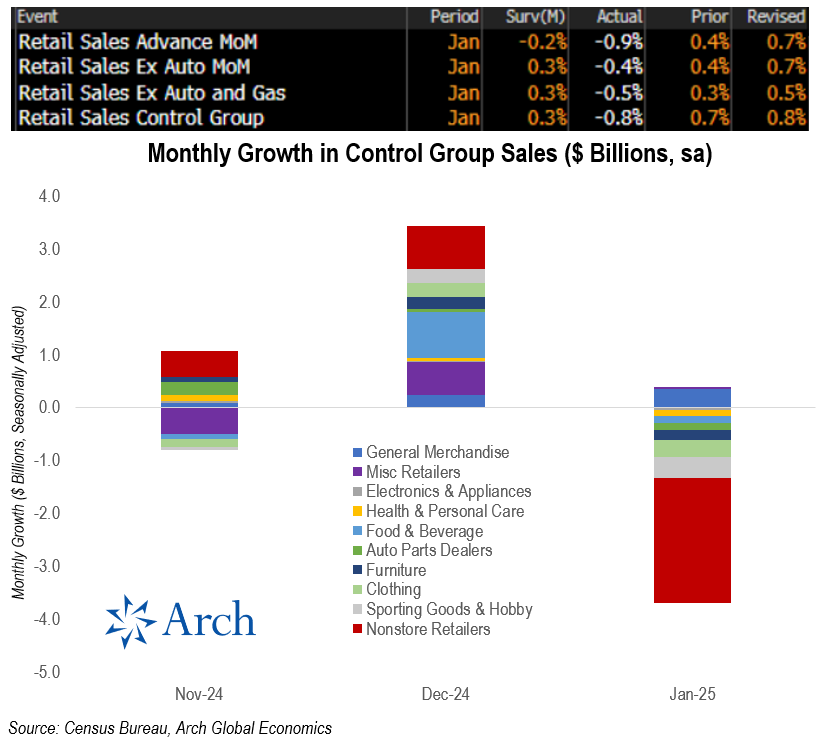
Before looking ahead, it’s worth sharing a few details on Friday’s Retail Sales data. As we see below, January retail sales came in well below estimates. The bright side of the report is that December’s figures were revised 0.3% higher. However, of chief concern, the control group, which directly feeds GDP, was 1.1% below estimates. Moreover, the graph below the data shows that eight of the ten control group categories were lower in the month. The biggest hit came from online retailers.
This week will be quiet on the earnings and economic data front. Housing data and the Philadelphia Fed index are the data headliners. The Fed minutes from its meeting three weeks ago will shed some light on the latest Fed mindset. Additionally, a plethora of Fed members will speak.
The Impact Of Tariffs Is Not As Bearish As Expected
There are many media-driven narratives about the impact of tariffs on the economy and the markets. Most of them are incredibly bearish, predicting the absolute worst possible outcomes. For fun, I asked ChatGPT what the expected impact of Trump’s tariffs will likely be. Here is the answer:
“One of the immediate consequences of increased tariffs is higher consumer prices. Tariffs function as an import tax, and companies that rely on foreign goods often pass these costs onto consumers. This could lead to higher inflation, particularly in electronics, automobiles, and household goods, where China plays a dominant role in supply chains.
Over the longer term, Trump’s tariffs could contribute to stagflation—lower economic growth combined with persistent inflation—if businesses struggle to adjust. While the intended goal is to bring jobs and manufacturing back to the U.S., the broader economic risks suggest that tariffs could ultimately slow growth and raise costs for American consumers and businesses.”
To see if ChatGPT is correct in its assessment, we need a proper definition of “stagflation.”
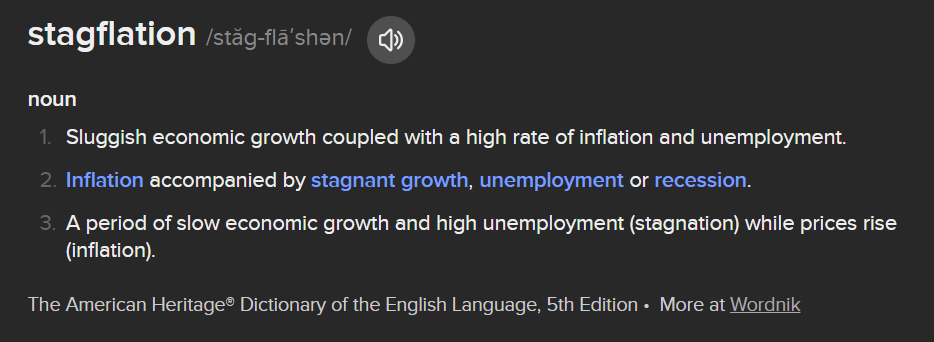
Notably, most analyses of “stagflation,” from which ChatGPT drew its answer, exclude the third component of the definition – unemployment. While individuals trying to sell gold or use “stagflation” headlines to get clicks, they conveniently leave out the most crucial ingredient of the definition. As shown, during Trump’s first administration, the impact of tariffs on inflation was not what the media suggested would happen. Inflation averaged close to the Fed’s 2% target during that previous term. However, as should be expected, inflation did rise in response to more robust economic growth rates and vice versa.
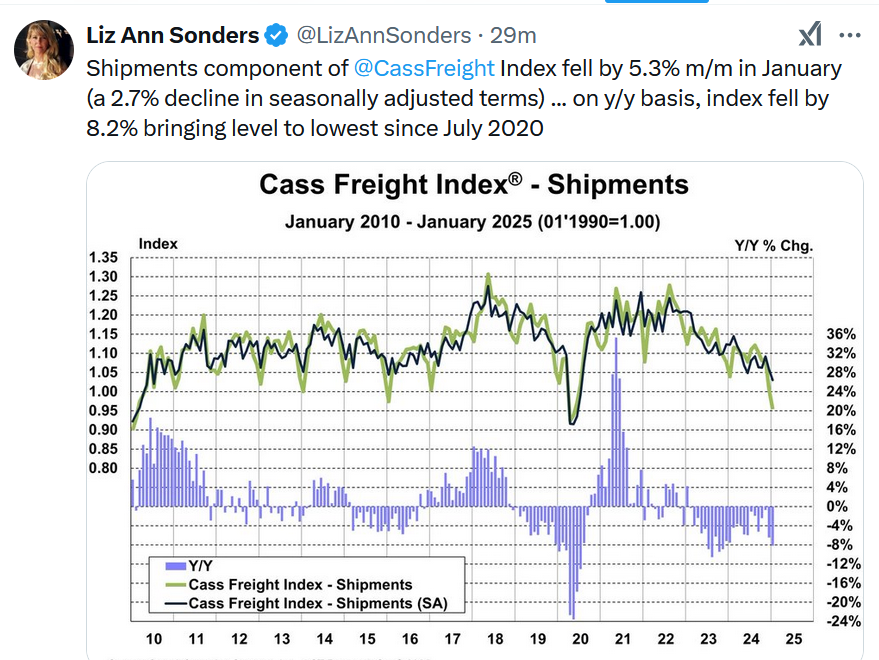
Tweet of the Day
“Want to achieve better long-term success in managing your portfolio? Here are our 15-trading rules for managing market risks.”