
Trending

Peter Schiff tweeted the following in regards to the Chicago Fed National Activity Index (CFNAI):
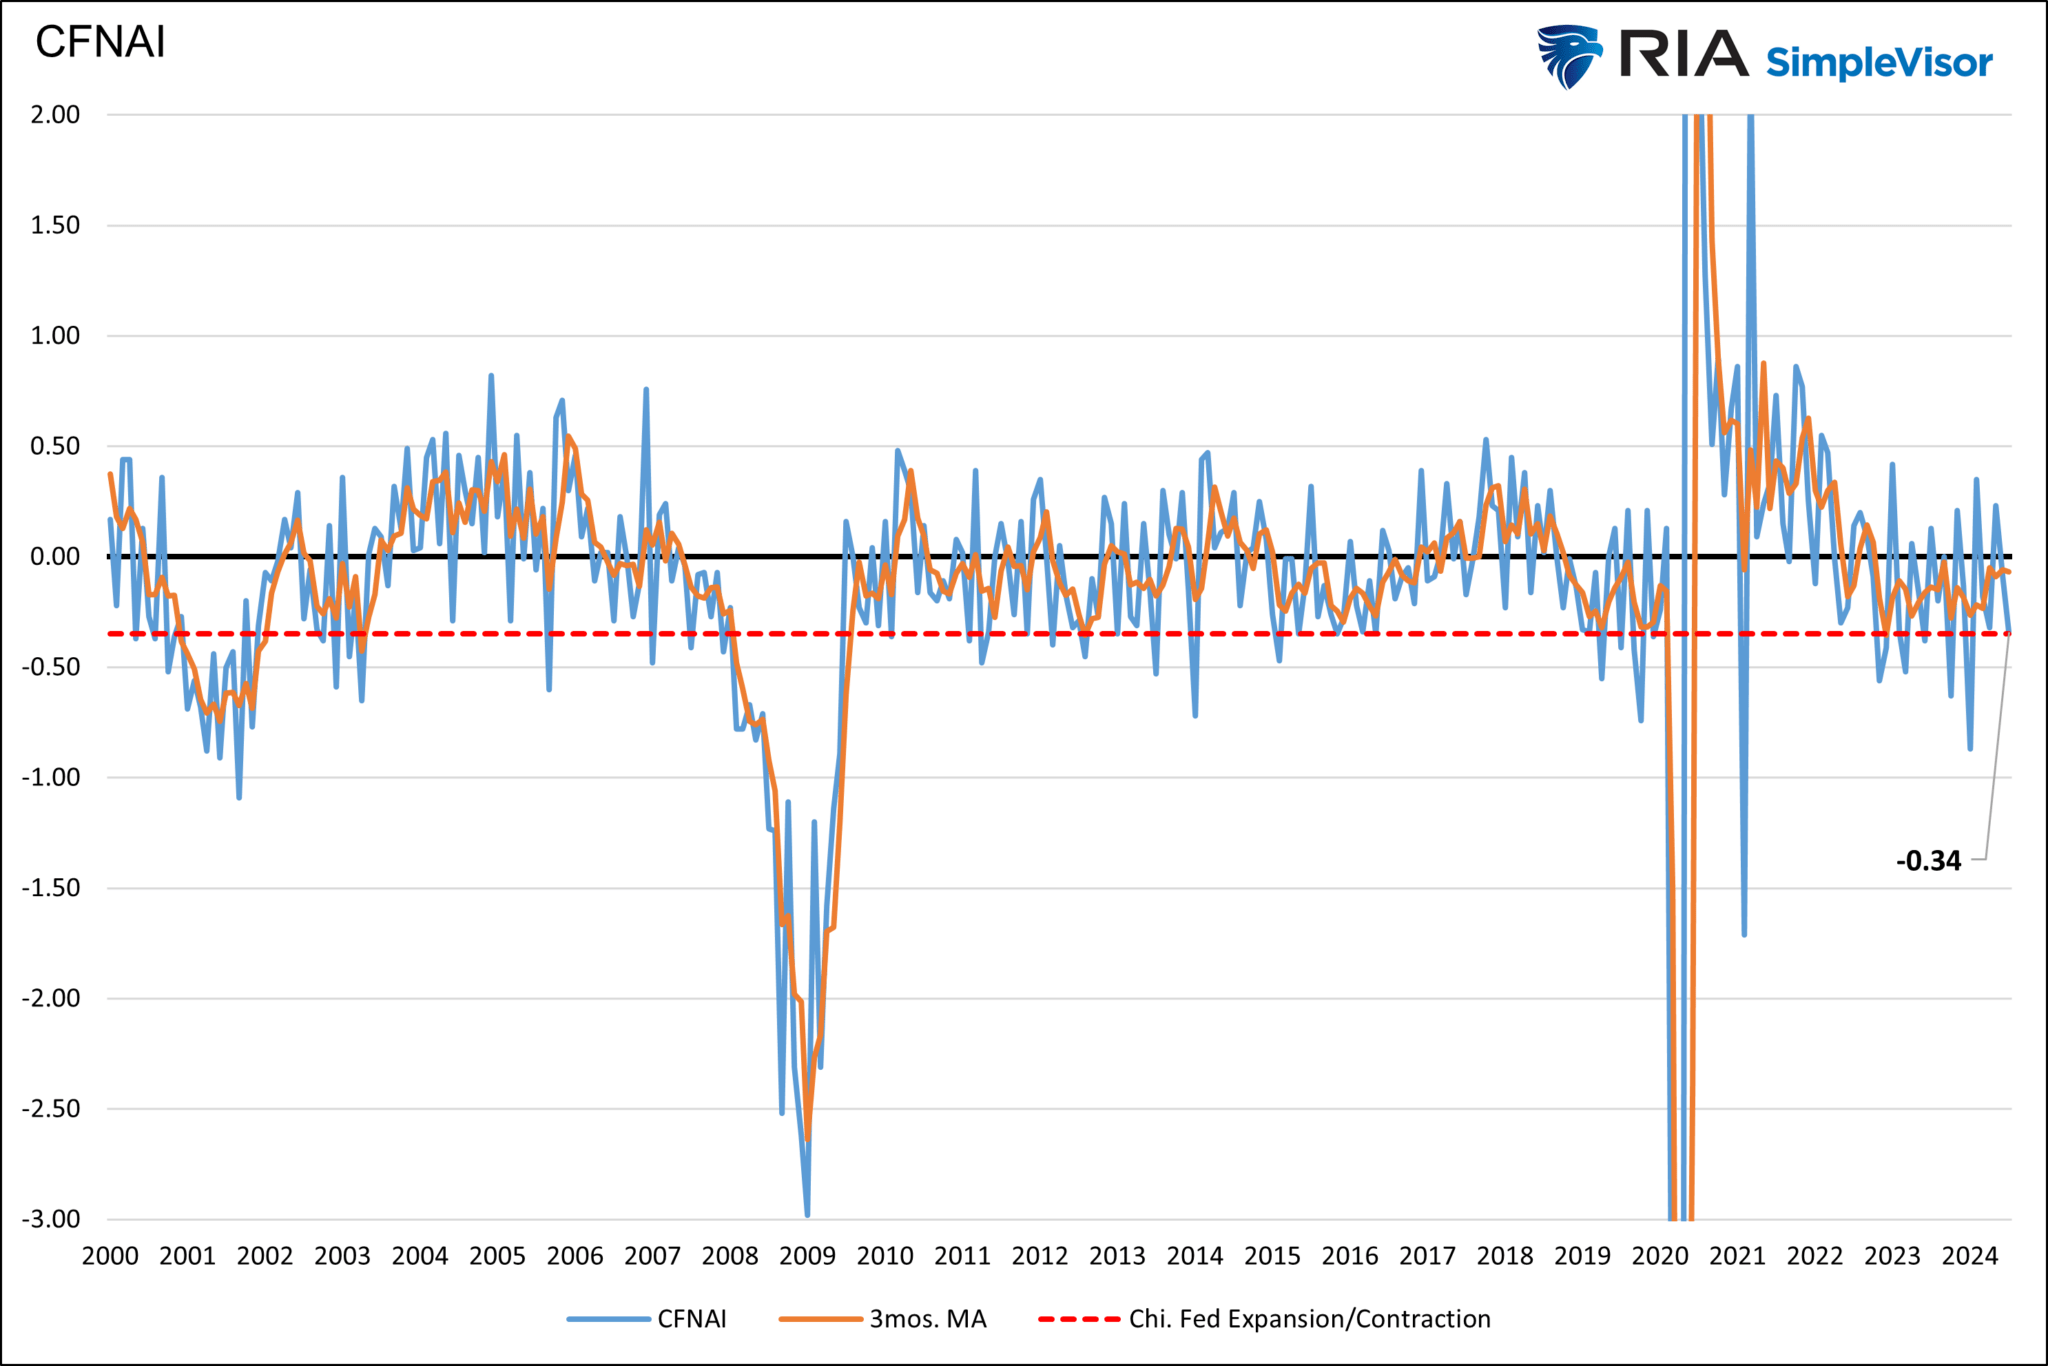
The July Chicago Fed National Activity Index ‘unexpectedly’ plunged to minus 0.34, its lowest since April 2020, when the economy was initially shut down by the COVID pandemic.
Peter’s commentary is undoubtedly concerning. However, if you examine the CFNAI data and its long-term history, you will quickly realize the most recent data point is not as irregular as he alludes.
The Chicago Fed generally considers periods of economic expansion to be when the three-month moving average of the CFNAI is above –0.35. The graph below shows that the recent reading is near the -.35 line in the sand. However, the CFNAI tends to be volatile; thus, we and most economists look at this data using trends. Despite the “unexpected plunge,” the three-month moving average fell 0.01 to -.07. Accordingly, it is well above the -.35 level we note above.
We like CFNAI a lot due to its breadth of economic indicators across all major parts of the economy. Once you recognize the nature of the data and its volatility, it’s hard to find anything concerning about the recent reading. Our tone will change if the next few months are similar to the current reading, but Peter Schiff’s comments are not too concerning for now.
The Cash On The Sidelines Myth Debunked Again
It seems like a day doesn’t go by without someone presuming the stock market is due to rally, as there is a tremendous amount of cash on the sidelines. The Tweet below exemplifies this common sentiment.
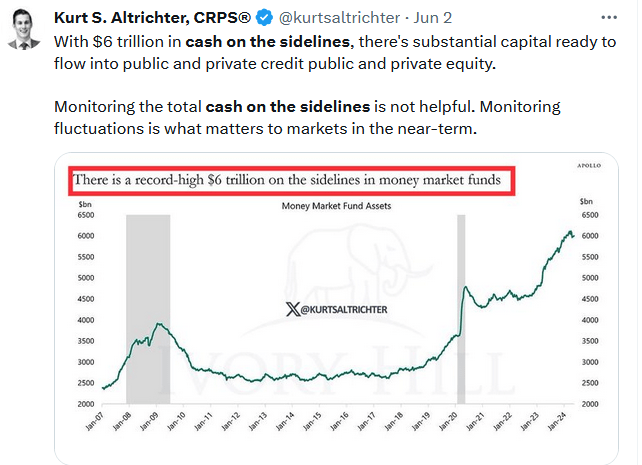
The graph shows that the amount of cash in money market funds has increased threefold over the last four years. This cash is the supposed fuel for a coming surge in stocks. We think the argument is nonsense. If the money on the sidelines bought stocks, by default, they would give their cash to the stock sellers. The seller’s cash would replace that cash coming off the sidelines.
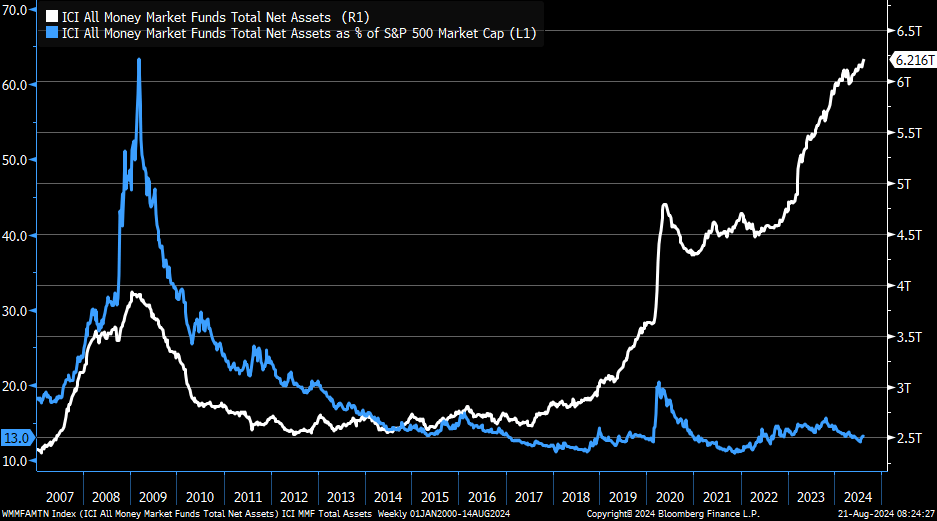
The second graph should give you a reason to pause if you buy into the cash-on-the-sidelines argument. The amount of cash available to buy stocks may have increased significantly, but so has the size of the asset markets. As a percentage of the market cap of the S&P 500, money market fund balances are at the same level as in 2018. There are reasons to be bullish, but the graph in the tweet above is not one of them.
More Concerning Employee Sentiment
Wednesday’s Commentary shared pessimistic data from the University of Michigan sentiment survey on the expected change in incomes for 2025. As we discussed, the survey is at levels associated with prior recessions. Weak sentiment regarding wages or job security can lead to weak consumer confidence, which in turn can negatively impact the economy. In its latest labor survey, the Federal Reserve of New York confirms the growing negative sentiment in the labor markets. Per the survey:
The proportion of individuals who reported searching for a job in the past four weeks rose to 28.4 percent from 19.4 percent in July 2023, marking the highest reading since March 2014, according to the July 2024 SCE Labor Market Survey. The expected likelihood of moving to a new employer increased to 11.6 percent from 10.6 percent in July 2023. Satisfaction with wage compensation, nonwage benefits, and promotion opportunities at respondents’ current jobs deteriorated by 3.2, 8.6, and 9.3 percentage points from July 2023, falling to 56.7 percent, 56.3 percent, and 44.2 percent, respectively.
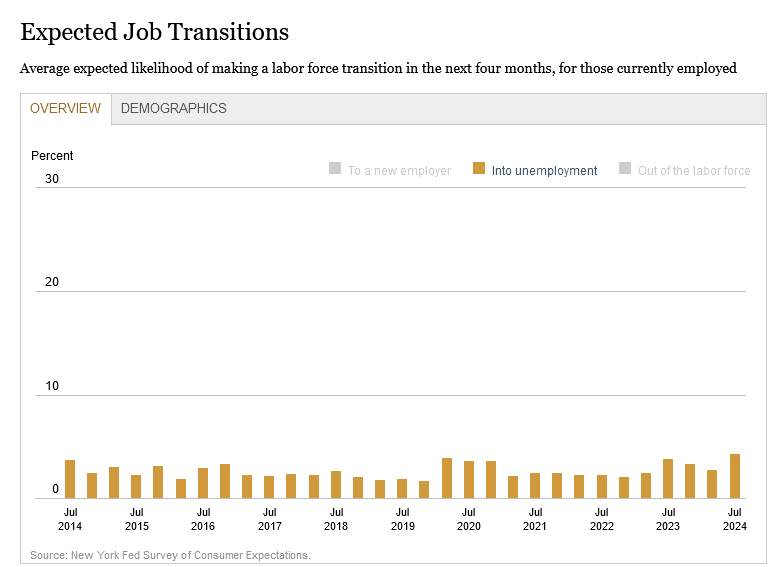
The report’s graph below shows that 4.4% of those surveyed expect to enter unemployment in the next four months, the highest level since at least 2014. Accordingly, we will seek confirmation in broader consumer sentiment surveys and retail sales data.
Tweet of the Day

“Want to achieve better long-term success in managing your portfolio? Here are our 15-trading rules for managing market risks.”
Related: Jackson Hole Takes Center Stage