Trending

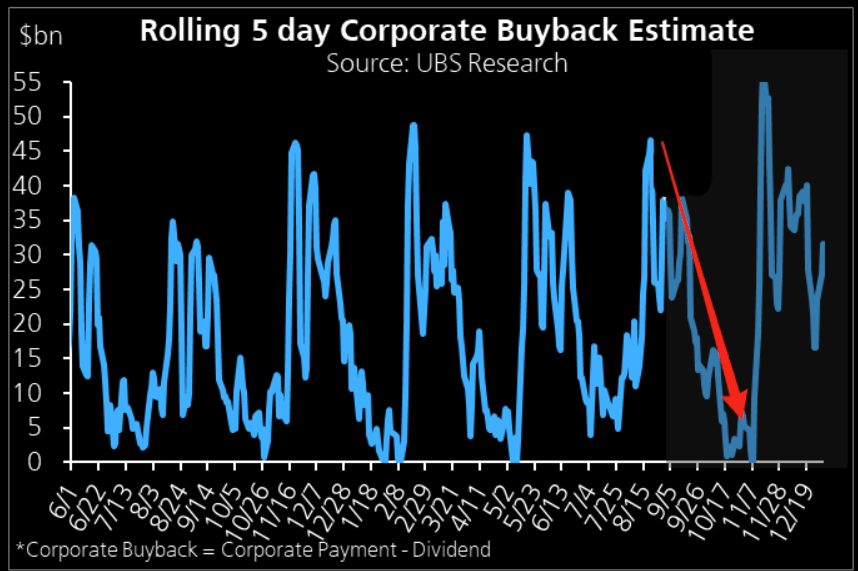
Like the meteorological seasons, share buybacks also follow predictable patterns. Accordingly, as shown below, we are past the peak share buyback season. Following the peak, share buybacks will decline rapidly until early November. Declining share buybacks is not a bearish indicator per se. However, as the number of buybacks declines, the market, and specifically the stocks conducting buybacks, will have less demand for their stock. Think of share buybacks as a tailwind.
The pattern is predictable because it directly relates to corporate earnings reports. For three reasons, most companies impose a ban on share buybacks about a month before their quarterly earnings report.
- Insider Trading Concerns– Employees have access to non-public information regarding their earnings. Therefore, the ban helps eliminate the perception the company might be trading its stock on such information.
- Investor Perception– Similarly, investors might be suspicious if the company was actively buying its stock right before the earnings announcements. If the investors were mimicking the company’s purchases, this could create heightened volatility in the stock.
- Regulatory Concerns– While there is no SEC regulation against share buybacks before earnings, most companies want to avoid an SEC investigation if the SEC suspects those buying back the shares have inside information.
What To Watch
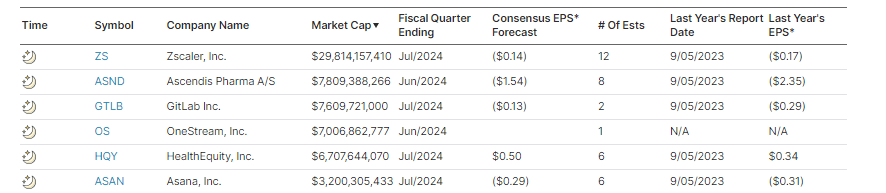
Earnings
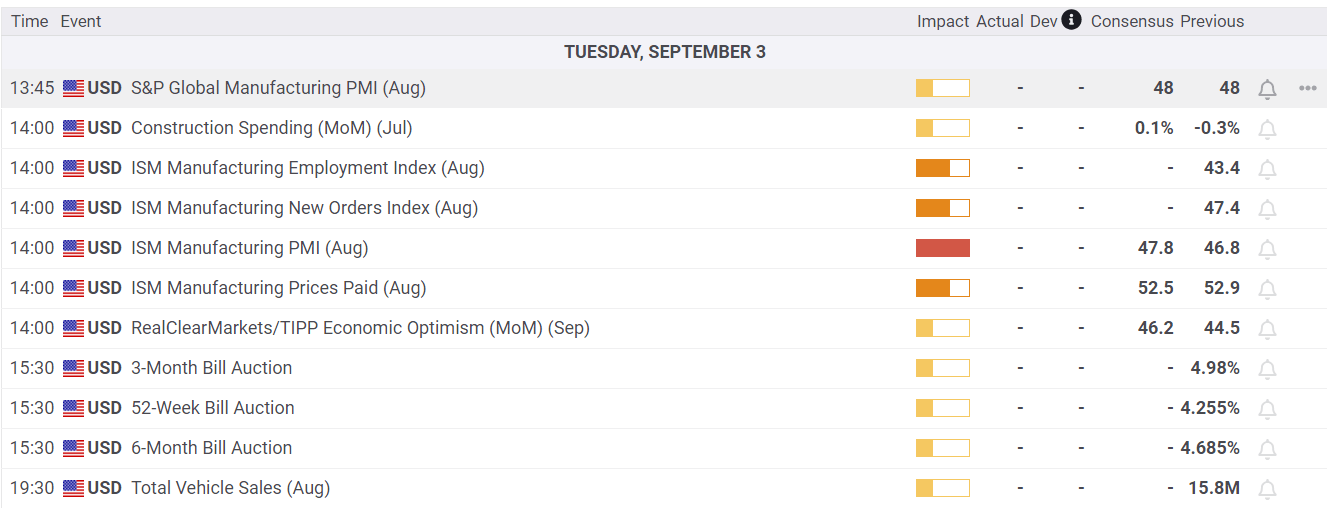
Economy
Market Trading Update
As noted last week, the rapid rally from the lows of three weeks ago had some good and bad elements.
“The positive is that the rally reversed the MACD “sell signal,” suggesting the bullish bias has returned. Furthermore, the rally cleared all-important resistance levels with ease. The market quickly crossed the 100, 50, and 20 DMAs, leaving only recent all-time highs as significant next resistance. The only negative to the advance is the nearly complete reversal of the previous oversold conditions. Such isn’t a critical issue, but it suggests we will likely see a minor pullback to retest support at the 50-DMA. Such will provide a better entry point to add exposure as needed.”
This past week, the market struggled to make gains, and as shown, its momentum has slowed. While such does not mean a major correction is imminent, it does suggest that the upside is likely limited, and a continued consolidation or pullback to previous support levels should be expected. Notably, a negative divergence is developing between momentum, strength indications, and market performance. We last mentioned such a negative divergence was in late July before the August correction.
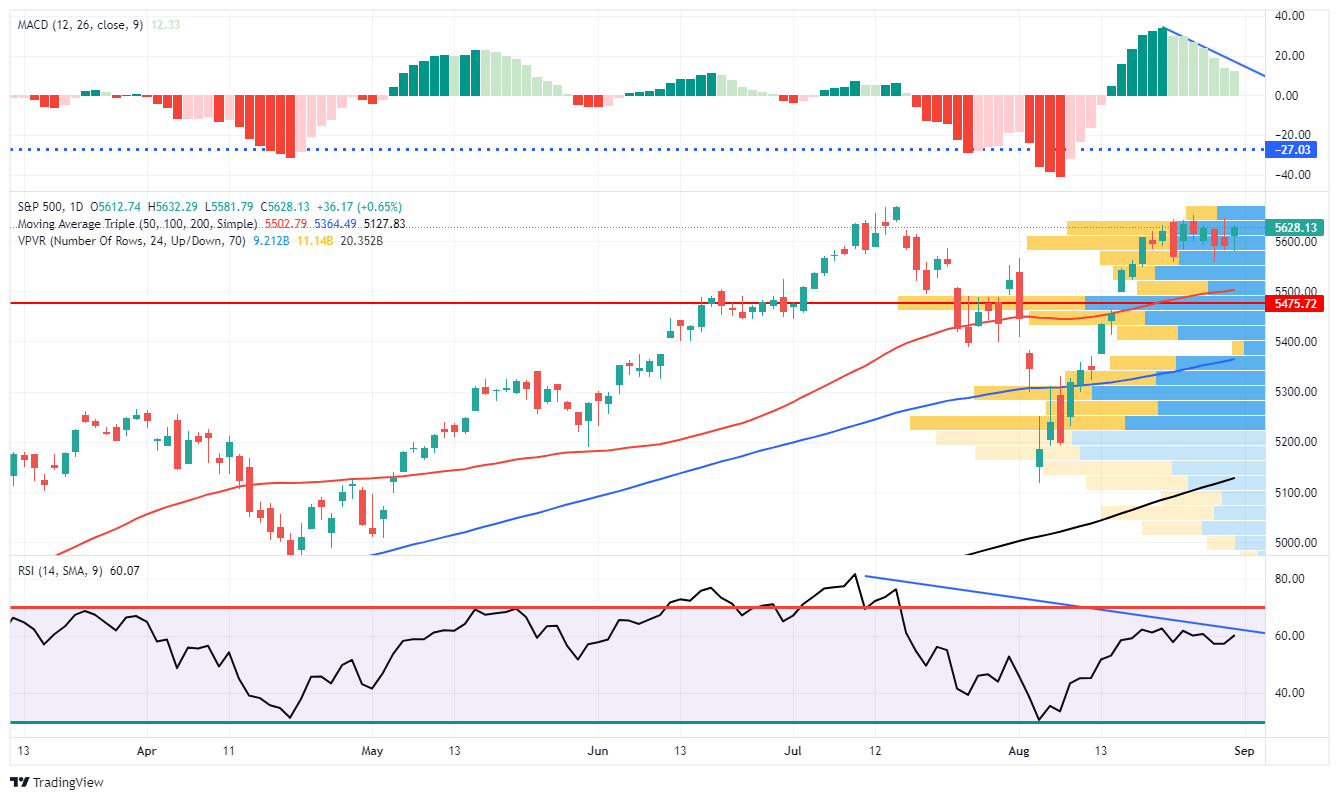
Over the next month, two potential catalysts may lead to a short-term correction to the 100-DMA or recent lows, where most buyers were previously found. The first is that corporate buybacks, which supported the rally from the recent lows, will begin to fade starting September 5th. The second is the upcoming election in November, when managers may de-risk portfolios ahead of that event.
While markets can make all-time highs soon, the decline in momentum and relative strength is certainly a cautionary tale. Just as a reminder, September and October tend to be weak performance months for the market, and the addition of a leadership or policy change could add to that risk.
Continue to manage risk as needed.
PCE Prices & The Week Ahead
The Fed’s favored inflation indicator, PCE Prices, was exactly as the market expected. Both headline and core PCE rose 0.2% for the month. As shown below, the headline and core year-over-year rates were 2.5% and 2.6%, respectively. The market reaction was muted as the numbers were as expected.

The headline economic data this week will be unemployment. Given the Fed now seems to be heavily focused on the weakening employment market, this week’s figures will provide the market with better clarity on whether the Fed cut rates by 25bps or 50bps. Leading off on Wednesday is JOLTs. The various statistics within JOLTs have been more real-time than the BLS report in alerting the Fed and economists of the softening jobs market. In particular, pay attention to the hires and quits rate. ADP on Thursday has also been a leading employment indicator compared to the BLS report. Expectations for ADP is an increase of 150k jobs.
Lastly is the BLS report on Friday. A consensus of economists expects the total number of jobs to increase by 163k and the unemployment rate to slip by a tenth of a percent from 4.3% to 4.2%. If the labor reports come in or around consensus, we suspect the Fed will cut by 25bps.
In addition to employment data, the ISM will release its manufacturing and service sector surveys on Tuesday and Thursday, respectively. Pay attention to the labor and price components of both releases. Similarly to JOLTs and ADP, ISM employment has also led the BLS.
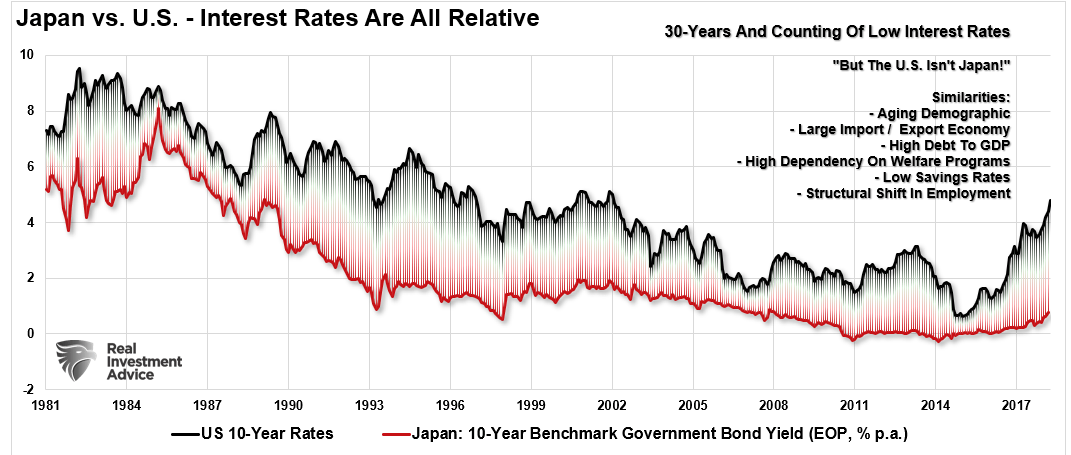
Japanese Style Policies And The Future Of America
With the current economic recovery already pushing the long end of the economic cycle, the risk is rising that the next economic downturn is closer than not. The danger is that the Federal Reserve is now potentially trapped with an inability to use monetary policy tools to offset the subsequent economic decline when it occurs.
That is the same problem Japan has wrestled with for the last 25 years. While Japan has entered into an unprecedented stimulus program (on a relative basis twice as large as the U.S. on an economy 1/3 the size), there is no guarantee that such a program will result in the desired effect of pulling the Japanese economy out of its 40-year deflationary cycle. The problems that face Japan are similar to what we are currently witnessing in the U.S.:
- A decline in savings rates to extremely low levels which depletes productive investments
- An aging demographic that is top-heavy and drawing on social benefits at an advancing rate.
- A heavily indebted economy with debt/GDP ratios above 100%.
- A decline in exports due to a weak global economic environment.
- Slowing domestic economic growth rates.
- An underemployed younger demographic.
- An inelastic supply-demand curve
- Weak industrial production
- Dependence on productivity increases to offset reduced employment
Tweet of the Day
“Want to achieve better long-term success in managing your portfolio? Here are our 15-trading rules for managing market risks.”