
Trending

Written by: David Waddell | Waddell and Associates
Once a quarter, the Federal Reserve releases its Summary of Economic Projections (SEP). This report contains FOMC member projections for the unemployment rate, inflation, and GDP. The Fed also includes an anonymous depiction of each member’s federal funds rate forecast within a “dot plot,” as seen below in December’s SEP:
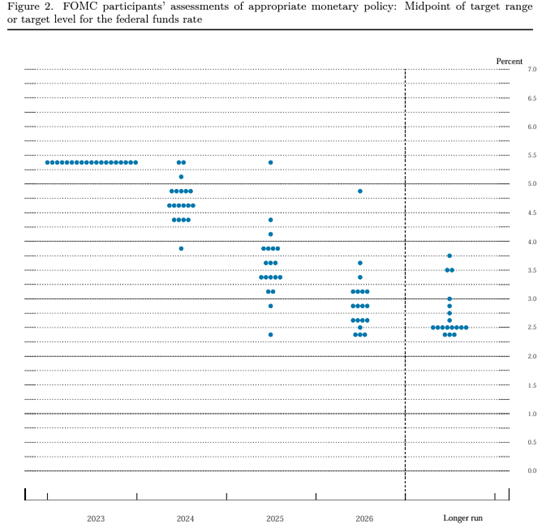
I recognize that for the unfamiliar, this chart looks particularly daunting, so I will spend some time interpreting it. For orientation, the horizontal base offers forecast timeframes: 2023, 2024, 2025, 2026, and the long run (also known as the neutral rate). The vertical access provides a range for the Federal Funds rate from 0% to 7%. The dots you see represent the interest rate predictions of up to 19 Federal Reserve officials, seven from the board of Governors and 12 from the regional banks. The Fed first released this survey in the wake of the financial crisis as Ben Bernanke wanted to provide markets with more insight into Fed policy direction after extreme policy actions. Ben also favored policy transparency which differed meaningfully from Alan Greenspan’s bias towards policy obfuscation. As market participants, we appreciate a more transparent Fed and view the “dot plot” as a powerful investment strategy tool. For example, based on the dots above, none of the survey participants foresaw any further interest rate hikes for the cycle. Two of the most “hawkish” participants predicted no change in the Federal Funds rate for 2024, thereby signaling their belief that the economy and inflation will grow more than consensus. One “dovish” member predicted the Fed would need to cut interest rates six times next year down to 4%, seemingly in response to a collapse in inflation or an economic recession. However, overall, the median forecast projected a total of three rate cuts for 2024, and while the potential range widens in 2025 from 2.4% to 5.4%, the median predicted another four rate cuts in 2025, suggesting seven rate cuts over the next two years. Whether the Fed cuts once, twice, thrice, or seven times will draw debate and scrutiny as the new “dot plot” arrives next week. However, from an investment strategy standpoint, direction matters more than degree, and the collective bias for interest rate policy is lower.
Armed with this information, investors should refer to history in search of winning investment strategies during rate cut regimes. Historically, once the Fed cuts, small company stocks dramatically outperform large company stocks:
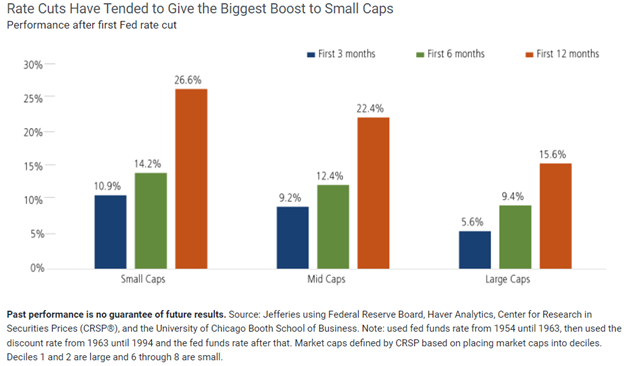
Since 1954, over the first three months after a rate cut, small caps have averaged 10.9% returns versus 5.6% for large caps. Over the first six months after a rate cut, it’s 14.2% versus 9.4%, and over the first year, it’s 26.6% versus 15.6%. Why such performance disparity? Small companies rely much more heavily on debt to fund operations:
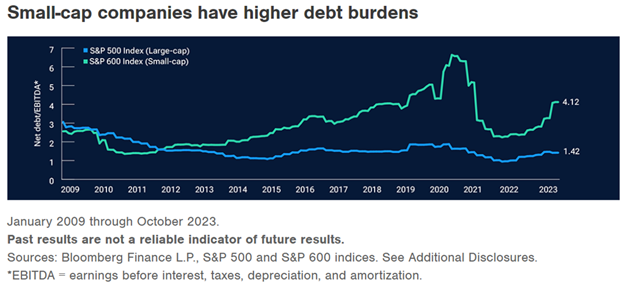
In fact, according to the data shown above, small caps carry nearly three times the amount of debt to earnings as large caps. Therefore, any reduction in interest rates should incite a surge in small cap earnings.
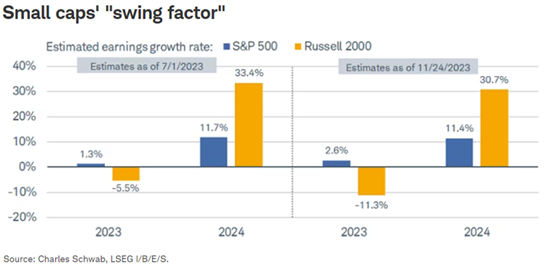
As seen above, analysts expect small cap earnings will rally 30% in 2024 compared to an 11% rise for large cap earnings. Of course, these estimates largely depend on a lower interest rate regime from the Fed, making small cap stocks particularly sensitive to any hot inflation headlines or hawkish speak from Federal Reserve officials. Year-to-date, small cap outperformance has been intermittent, and headline driven. Wall Street forecasters have scaled down rate cut expectations from six to three, which has advantaged large cap performance overall. However, we have seen a recent performance shift down the capitalization spectrum as the equal-weight S&P 500 (all 500 stocks get .2%) has recently outperformed the capitalization-weighted S&P 500 (the top 10 stocks get 30%+) despite hotter than expected inflation data in January and February:
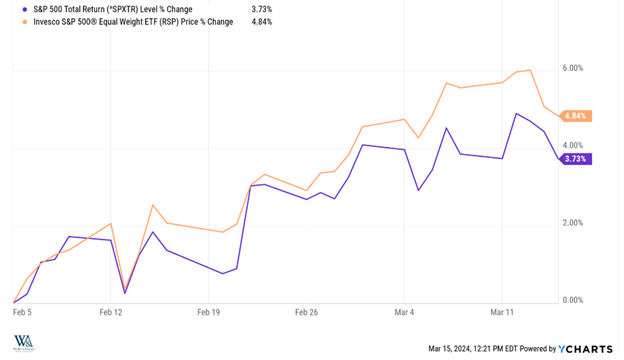
Since Early February the S&P Equal Weight index has not only performed the S&P Capitalization Weighted index (4.84% vs 3.73%), but it’s also outperformed the Magnificent 7 index (4.84% vs. 4.09%). Even more suggestive, the small cap Russell 2000 index outperformed all of them over the same period, returning 5.27% vs 3.73% for the large cap S&P 500.
In sum, the mere suggestion of interest rate cuts forthcoming in the Fed’s “dot plot” has drawn investor attention to the potential of outperformance from small caps, and algorithms have been programmed accordingly. Inflation headlines and Fed speak instantly trigger return advantages and disadvantages anticipating the probability, timing, and degree of rate cuts. More recently, however, we have seen more durable small cap outperformances, suggesting that investors, rather than traders, may be increasing allocations. With the Fed broadcasting rate cuts, small cap earnings expectations high and relative valuations low, small caps appear poised to run. Furthermore, performance breakdowns among the Magnificent 7 stocks create selling and reallocations. If this money studies the “dot plot” and market history, it will follow us down the capitalization spectrum and boost our returns.
Remember, you get paid if you are early…and you get played if you are late!
Related: Sustaining the Market Rally: Riding the Wave of the Inflationary Trend