
Trending

Bloomberg cites economist Richard Koo, who claims China is in a balance sheet recession. A balance sheet recession, as defined by Koo, is as follows:
He defines a balance-sheet recession as a situation in which households and businesses divert more of their income toward paying down debt, rather than consuming or investing. Koo argues that was a key reason for Japan’s descent into deflation, and for the slow US and European recoveries from the 2008 financial crisis.
While the article focuses on China’s balance sheet recession, U.S. investors should pay attention. Like China, the U.S. government and the Fed have reacted forcefully to avoid balance sheet recessions. To do so, they spur borrowing via lower interest rates and bailouts, worsening the debt load yet keeping interest expenses manageable. Additionally, the government has been recklessly spending to prop up the economy, bolstering private sector incomes and balance sheets.
While the ever-growing debt accumulation has fostered economic growth, it brings on financial instability as balance sheets are not allowed to return to equilibrium. In turn, the more potential instability, the more desperate actions are taken by the government and the Fed to stabilize the economy. As highlighted by Goldman Sachs ‘ table below, China is embarking on massive monetary and fiscal stimulus spending. Can they come to the rescue again, or are they following Japan’s “lost decades” where stimulus, no matter how much, can’t counteract excessive debt? More importantly, is the U.S. following China?

What To Watch
Earnings
- No notable earnings reports today
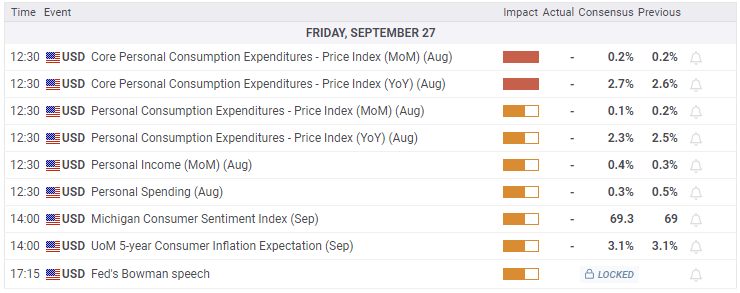
Economy
Market Trading Update
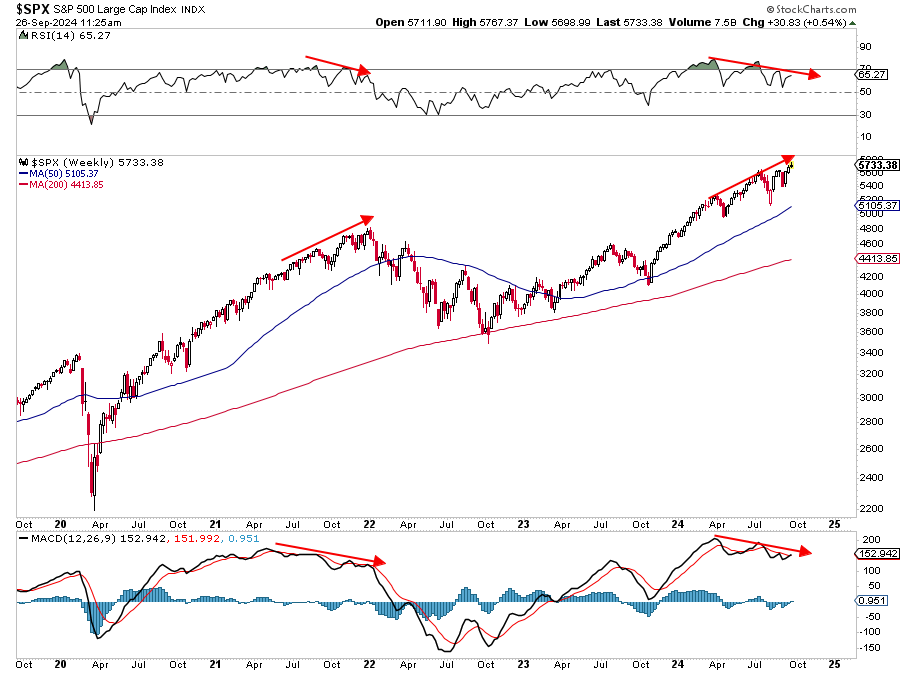
Yesterday, we discussed the short-term bullish “cup and handle” technical formation, which suggests higher prices in the near term. While the case remains today, there is a reason to question the potential magnitude of those gains as we approach year-end. As I discussed yesterday morning, the WEEKLY chart of the S&P 500 index has two concerning technical issues worth watching.
As shown, a building negative divergence exists in both currently overbought relative strength and momentum measures. From a weekly perspective, this is slow-moving data, so the market may seem to “defy gravity” for a while longer. However, we last saw a similar negative divergence heading into 2022. Then, like today, the bullish sentiment was very elevated, the “everything chase” was underway, and there seemed to be nothing to stop stocks from going higher…until they didn’t.
While I am not suggesting a similar outcome as 2022, previous negative divergences have seen markets at least consolidate gains for an extended period, if not correct, to some degree. While the bullish bias currently exists, it is becoming increasingly evident that most of the gains for the current rally have likely been made. Continue to manage risk accordingly.
Initial Jobless Claims
Despite the concerning graphs we shared yesterday regarding weakness in the labor market, initial jobless claims continue to signal that all is well. Last week’s initial jobless claims slipped to +218K, slightly below the +223K expected, and last week’s +222K. Jobless claims are now at the lowest level in nearly six months.
Economists often warn that jobless claims above 250k and rising are concerning. We haven’t seen 250k new claims in over a year. However, it’s important to note that jobless claims may be a faulty indicator. In Commentary from January 2024, we wrote the following:
Bloomberg estimates that the average wage coverage gap is bigger than ever at $1,400. Simply, unemployment claims payouts have not kept up with inflation. On the contrary, gig/part-time jobs have. Therefore, laid-off workers are better off working for Uber and other flexible gig economy jobs. Michael Green of Simplify Asset Management sums this up well. “Effectively, we’ve created private market unemployment insurance with gig economy work where the hassle/compensation of obtaining traditional unemployment insurance is simply not worth it. This is consistent with rising unemployment rates for college grads and suggests that policy is missing yet another important signal.” To his point, low-paying part-time jobs replace jobless claims but make the labor market look healthier than it is.

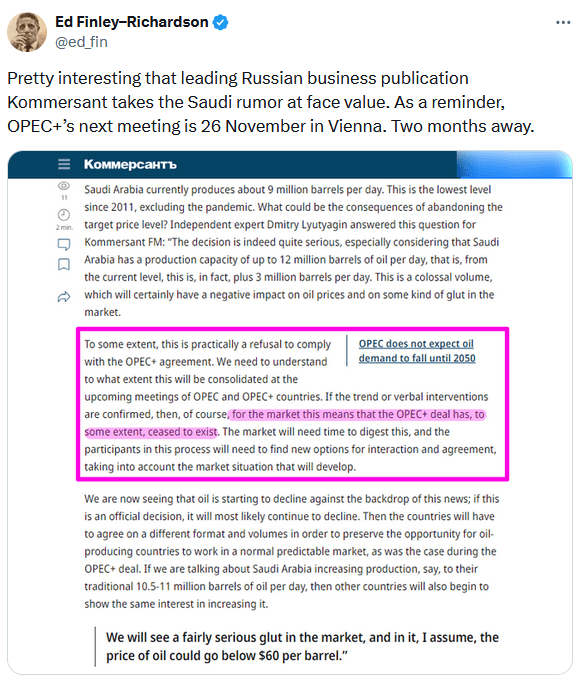
Dissaray At OPEC
A reader brought the following tweet from @ed_fin to our attention yesterday. Ed clipped a Russian news article that states that Saudi Arabia is not complying with OPEC target price agreements. It argues that Saudi Arabia, OPEC’s de facto leader, should be cutting oil production more aggressively. The author further states that the OPEC+ deal no longer exists. Therefore, if this is true, and that is very debatable, OPEC may have trouble reigning in production against the backdrop of weakening demand. Such could cause the oil price to push oil to $60 or below. The graph below shows that crude oil prices recently bearishly broke out of a wedge pattern. The horizontal support line is critical for oil prices to hold. If it trades below the line, the author may prove correct.

Tweet of the Day
“Want to achieve better long-term success in managing your portfolio? Here are our 15-trading rules for managing market risks.”
Related: How Agency REITs Benefit from a Bull Steepener Strategy