
Trending

There could be potential for upside, but at what risk? Here’s one investor’s 5-year view.
Wall Street forecasts about the future direction of the economy, stocks, bonds and other assets are easy to find. Many investors would probably put it another way: forecasts are impossible to get away from! Here’s another way to look at market predictions, using the real-world tradeoffs that drive what investors really care about.
What do they care about most? Making as much as they can without losing big. Or, as I say, ABL, Avoid Big Loss. What is “big” in this case? That’s unique to every investor.
Too often, financial pundits make a case for something to happen, but do so in a way that makes you think they have devout belief in that forecast. Though that may be the case, the knee-jerk reaction by some investors is to take that forecast and act on it in some way. I argue that unless a forecast includes some estimation of a wide variety of scenarios, it is closer to gambling than investing.
I spend many hours each week assessing two competing concepts: reward potential, and potential for major loss. The better the “reward/risk tradeoff,” the more likely I am to invest in something.
Time frame is important too. So today, more than at any time I can remember in 35 years of investing, sorting out what you “own” in your portfolio versus what you “rent” is critical.
Let’s zero in on my best guess forecast for the popular S&P 500 stock index. This is not a forecast for next week or next month. It is an estimate of the top-to-bottom range for the S&P 500 over the next 5 years. The goal is to highlight that reward/risk tradeoff, as I see it.
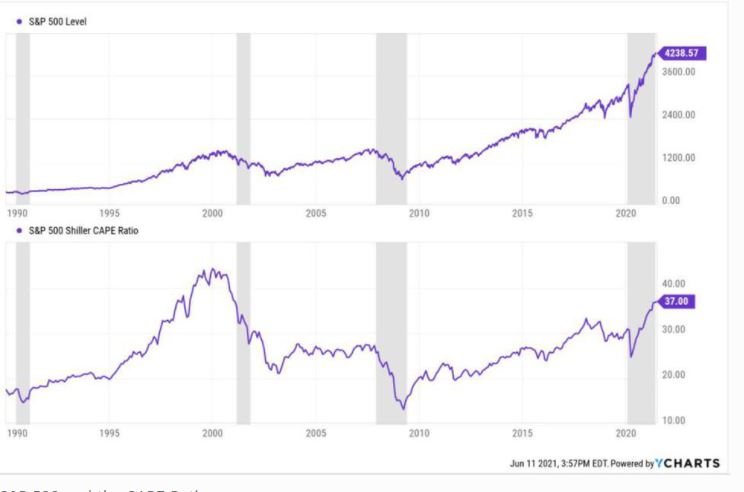
Here is the S&P 500 chart since 1990, and below it is the CAPE Ratio, a smoothed out version of a price-earnings ratio, created by Yale Professor Robert Shiller. Now the tough part: consolidating many hours of experience and assessment of the current market climate into a bottom-line forecast that is potentially useful.
THE FORECAST
The S&P 500 was at 4,238 as I wrote this on June 11, 2021. Over the next 5 years, relying on decades of portfolio management and technical analysis, my “best guess” is as follows:
Between now and June of 2026, the S&P 500 could be as high as 5,000, and as low as 2,000. Let me wait while you catch your breath.
I have discussed this with some of my investors, and the most common reaction is that they can’t comprehend that the S&P 500 could at some point be more than 50% lower than it is today. But that’s exactly what happened in the last two bull market cycles.\Consider this as an example of what can happen if you pin all your hopes on a bullish forecast: in February, 1997, the S&P 500 was around 800. It nearly doubled by the year 2000, then fell hard. By July, 2002, it was back at 800. Later that decade, the financial crisis took it back down to 800 again, and even below that level.
Bottom line: stock market investing is not a straight line.
We need to skip the averages and focus on a wide RANGE of possible outcomes. Then, manage the portfolio to account for that range of possible scenarios. This is what the buy-and-hold crowd either accepts, denies, or ignores, depending on their specific situation.
So, the 2,000 low point in the forecast is simply based on what history implies. The 5,000 “top” of the 5-year forecast allows for the possibility that the market euphoria/FOMO is not yet finished. The CAPE Ratio, at around 37, is roughly 20% below its Dot-Com Bubble record high. If we get there, and assume that the S&P 500 rally has that much upside room, we get about 5,000.
Which comes first, the high or the low?
I have no idea, and neither does anyone else. The last few decades have shown us that the top and bottom of those 5-year ranges could happen in either order. Or, maybe neither will happen. Remember, its a best-guess forecast!
The key to this or any forecast is this: if you believe that the forecast has some merit, is your portfolio prepared for anything resembling that range of outcomes? Do you have a plan if we hit 5,000 or so, then experience a 50-60% decline over a few years, a la 2000-2003?
Scout Motto: always be prepared
And, if the market peaks this year or next year, are you prepared to play defense and offense throughout that volatile cycle? Or, will you leave it to chance, and assume that the last 30 years of market history mean nothing in today’s Social Media, Big-Tech, Crypto-infused environment? I hope you don’t do that, and instead consider the wide range of possibilities that exists in these strange times.