
Trending

The Fed cut rates on September 18th and many expect them to follow through with more rate cuts in the coming meetings. Yet bond yields have steadily risen. Why is this occurring? While there are many answers, it boils down to two primary reasons. As we will explain, the Citi Economic Surprise Index is rising. Furthermore, as we noted on numerous occasions leading to the FOMC meeting, bond prices were very overbought.
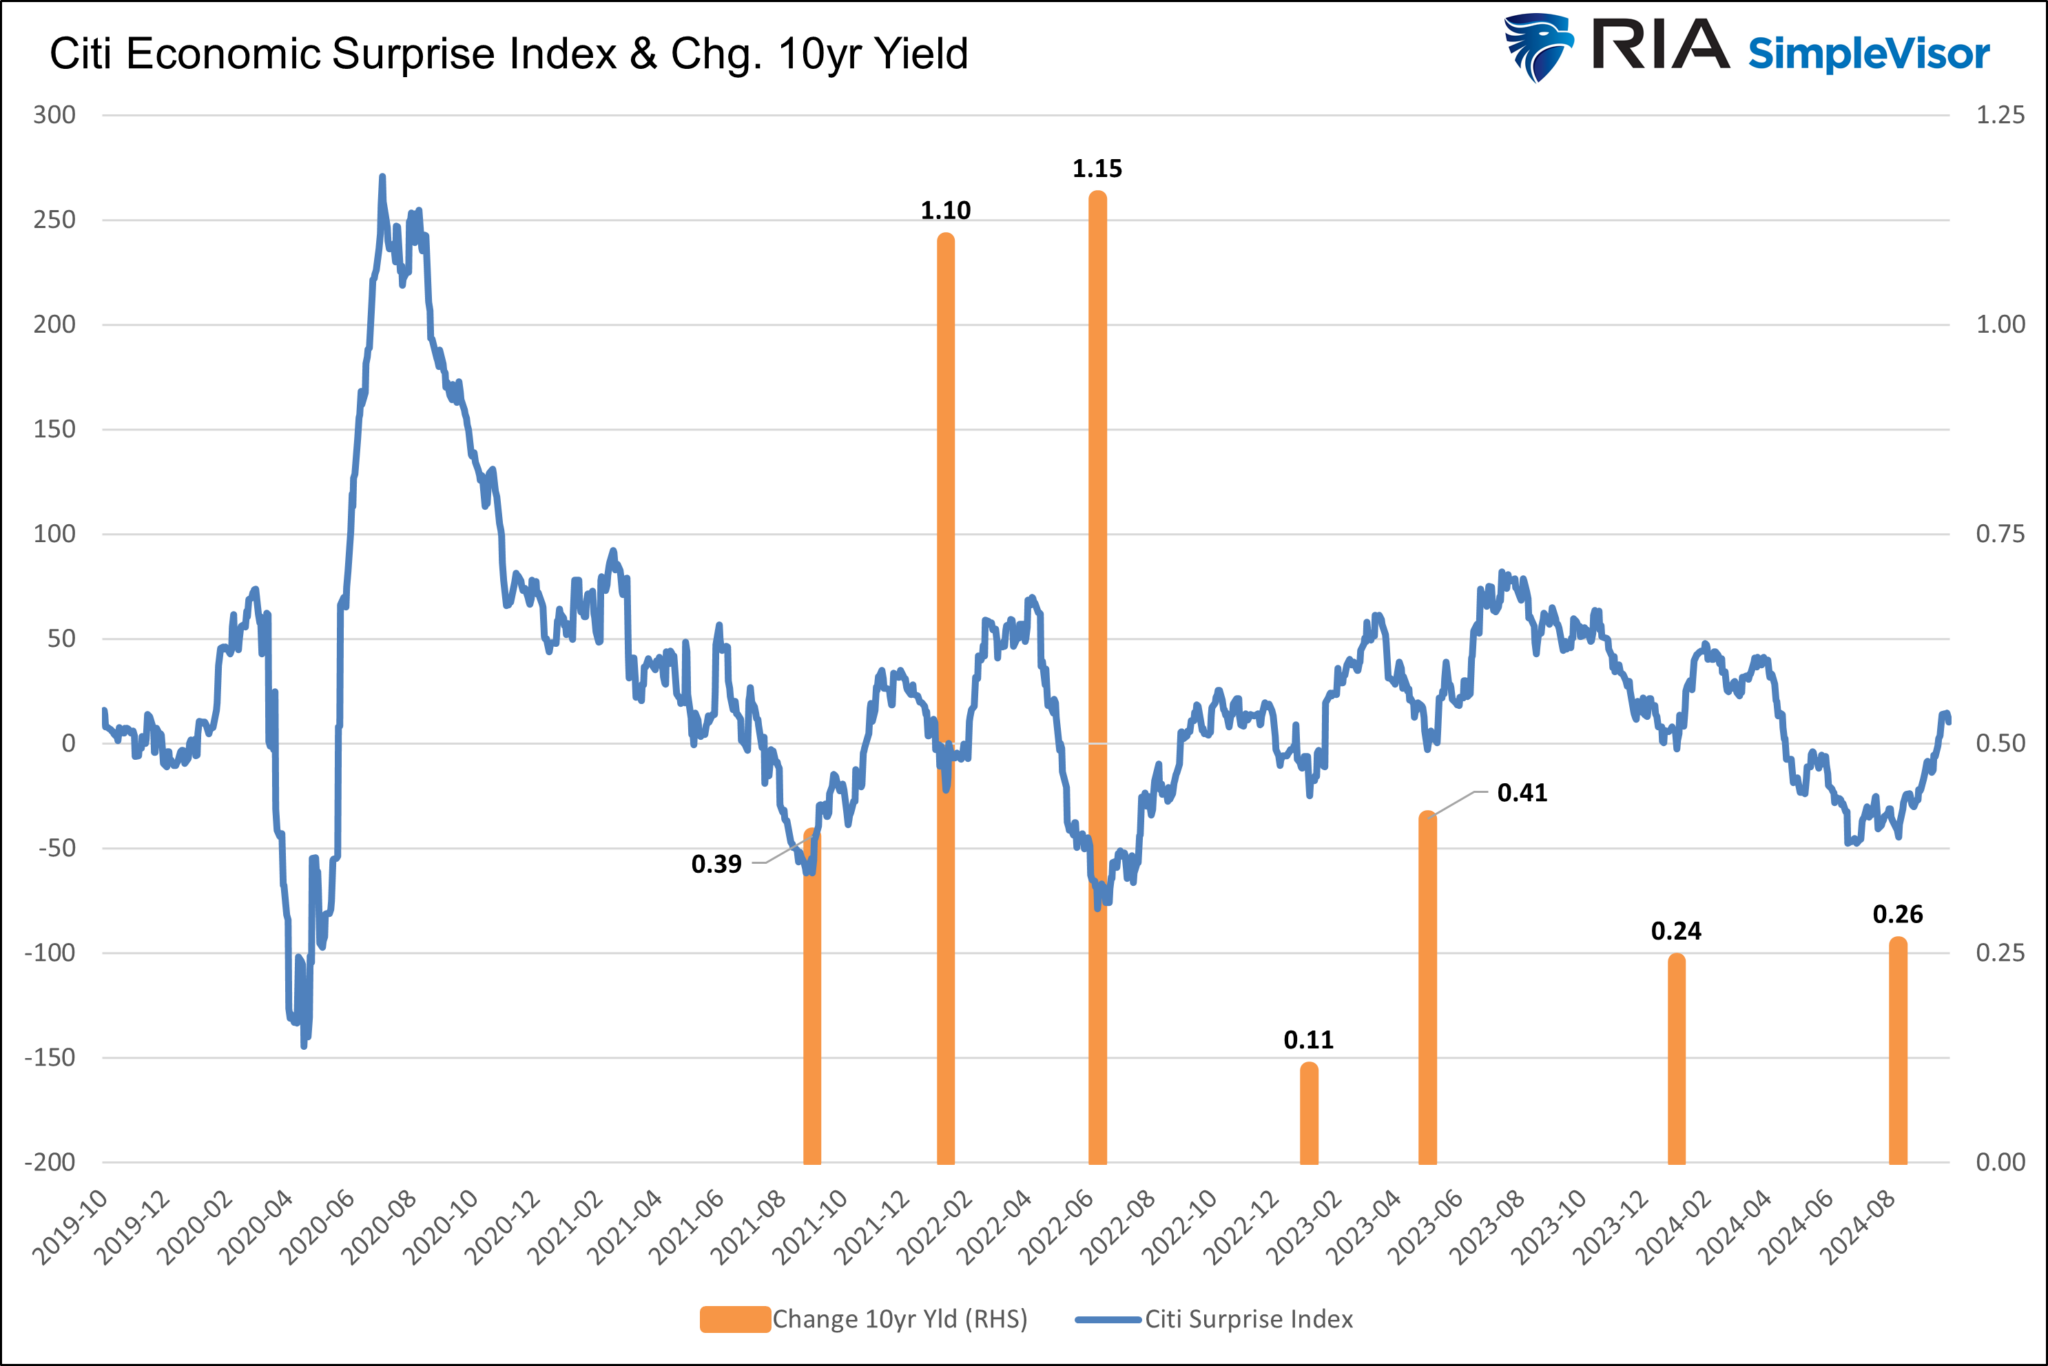
The Citi Economic Surprise Index measures whether economic data performs better or worse than Wall Street estimates. When the index rises, economic data performs better than expected; conversely, when it falls, it is worse than expected. The graph below charts the Citi Economic Surprise Index. Moreover, to show how it relates to bond yields, we also show how ten-year UST yields changed when the index troughed and rose. The last three cycles from trough to peak saw yields rise between 11bps and 41bps. Currently, yields are up 26bps, which is about the average for this recent history. It’s worth adding that the two surges in yields were occurring as the Fed aggressively raised rates and inflation started soaring. Therefore, there were many factors, not just the Citi index, driving yields higher.
Bond prices are now oversold. Once the Citi Economic Surprise Index peaks and starts to reverse, bond yields will likely resume their trend lower. The most recent yield change on the graph is to date, not peak, as there is no indication the Citi index has peaked yet.
Regarding the technical situation leading to the FOMC meeting, we share a sentence from our Daily Commentary, the day before the rate cut.
With the Fed meeting this week, the current setup suggests that even if the Fed cuts rates as expected, this could be a “buy the rumor, sell the news” setup for bonds.
What To Watch
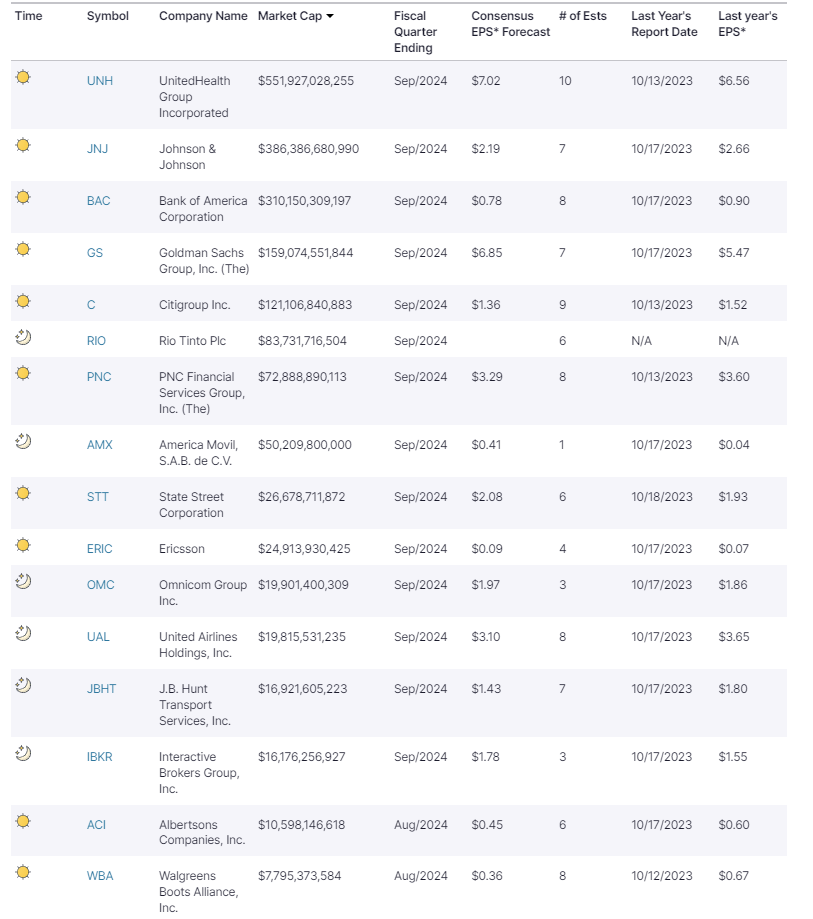
Earnings
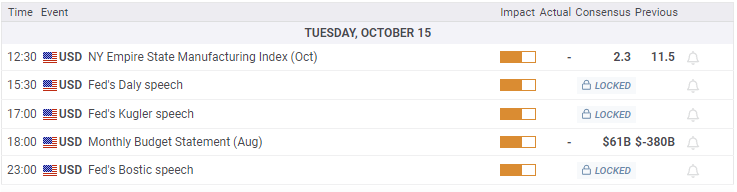
Economy
Market Trading Update
As noted yesterday, the market broke out to the upside of the ascending wedge pattern, triggering a “seasonal MACD buy” signal.
“Notably, that buy signal marks the beginning of the seasonally strong 6 months of the year. The series of high lows, now combined with higher highs, remains a significant bullish backdrop for investors. With earnings season starting in earnest this coming week, the bias remains to the upside, but risk management protocols should not be abandoned.”
While the “buy signal” for the “seasonally strong period” has been triggered, it doesn’t mean there are no risks to be aware of. The chart below is a longer-term chart going back to 2007. It is worth noting the negative divergence in the Relative Strength Index (RSI) which does suggest some concerns. Historically, such negative divergences preceded corrective periods. However, given that this is weekly data, such corrections can be several months to a year away. Secondly, the deviation from the 5-year moving average and the weekly MACD signal are certainly elevated. The last time the MACD signal was as elevated as it is now and was flipping back and forth on “buy signals” was mid-2021. Of course, the market corrected by 20% in 2022. Lastly, with the market at the upper end of its trend channel from the 2009 lows, such suggests that outsized gains from here are unlikely.

The takeaway from this analysis is that in the short term, over the next two months, the market is very likely to be higher than it is currently. However, once we get into 2025, the risk of a modest correction of 10% or more will increase to relieve some extended market conditions.
While the “seasonal buy signal” is bullish, it does not mean that corrections cannot occur along the way. Trade accordingly.
Into The Presidential Election Home Stretch
Greg Valliere is a Washington insider with over 40 years of experience analyzing and assessing the political landscape. With only a few weeks until the election, we again share some of Greg’s daily snippets from his “Morning Bullets.”
- WE WROTE LAST FRIDAY that Kamala Harris was stalling out, and we wouldn’t change a word. Her lead has evaporated, slowly, to an advantage nationwide of 2 or 3 points, while Donald Trump leads by nearly 20 electoral votes.
- LIKE IN BIG SPORTS GAMES, momentum is crucial and hard to predict in political campaigns. There’s usually 4 or 5 momentum swings, and this year will be no exception.
- BOTTOM LINE: The race is a virtual tie. There will be several state recounts. There will be numerous allegations of voter fraud. In a race this close, there will be ties in several states. You want to know the outcome of the Nov. 5 election? Wait until December — or longer.
Safety Sectors Follow Bonds
Since the FOMC rate cut in mid-September, bond yields have risen consistently. As a result, four of the more conservative stock sectors, also among the highest dividend-yielding sectors, have underperformed the market. The logic appears to be that the Fed may only cut a few more times as the economy remains robust and the labor market is not showing signs of significant weakening.
As our SimpleVisor relative analysis below shows, staples are the sector that is most oversold on a relative basis. Healthcare and real estate have similar oversold scores. Utilities, also a conservative sector with higher dividends, have been bolstered by the surging demand for more electricity due to the massive expansion of AI data centers. However, utilities have gone from the most overbought sector to the middle of the pack over the last few weeks.
It’s also worth noting that the absolute scores on technology, industrials, and financials are overbought on an absolute basis. This should not be surprising, given the market as a whole is technically overbought. Going into the election, sector rotation will likely be a function of the changing odds of which party will win the presidential campaign and the House and Senate.

Tweet of the Day

“Want to achieve better long-term success in managing your portfolio? Here are our 15-trading rules for managing market risks.”
Related: GDP Report Continues to Challenge Recession Predictions