
Trending

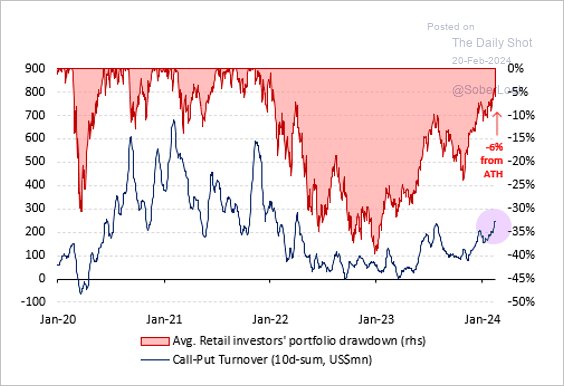
After over two years, retail investors, also known as the “dumb money,” are almost back to breakeven. A recent chart by Vanda Research shows that the average retail “dumb money” investor portfolio still sports a drawdown despite the markets making new all-time highs.
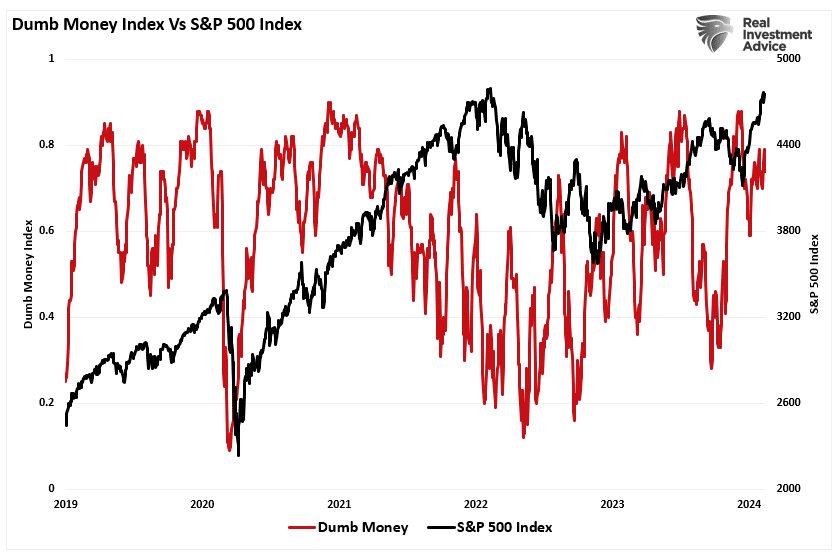
Such is unsurprising, given that retail investors often fall victim to the psychological behavior of the “fear of missing out.” The chart below shows the “dumb money index” versus the S&P 500. Once again, retail investors are very long equities relative to the institutional players ascribed to being the “smart money.”
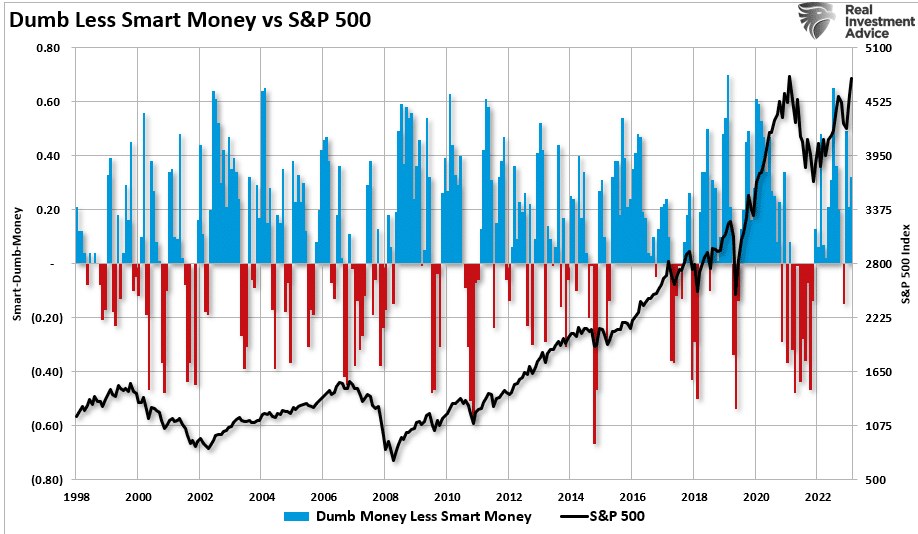
The difference between “smart” and “dumb money” investors shows that, more often than not, the “dumb money” invests near market tops and sells near market bottoms.
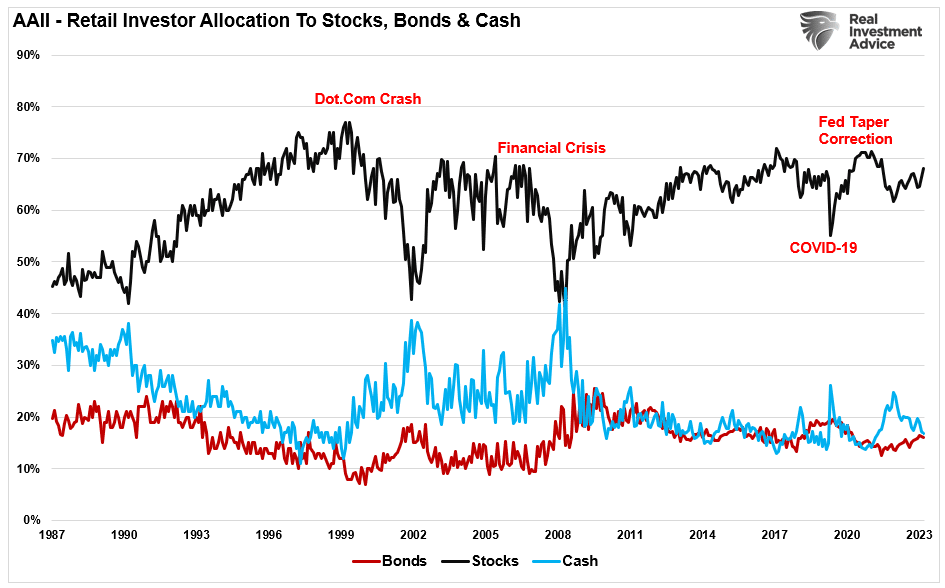
We can confirm the “smart/dumb money” analysis by looking at the allocations of retail investors in stocks, bonds, and cash. With markets overvalued and hitting all-time highs, it is unsurprising that retail investor equity allocations are at very high historical levels with low holdings of cash and bonds.
Of course, it isn’t that retail investors are chasing the markets higher; it is what the “dumb money” is chasing that is most interesting.
Chasing The Russell 2000
Last week, I discussed the relationship between the NFIB data and the Russell 2000 index. As I noted:
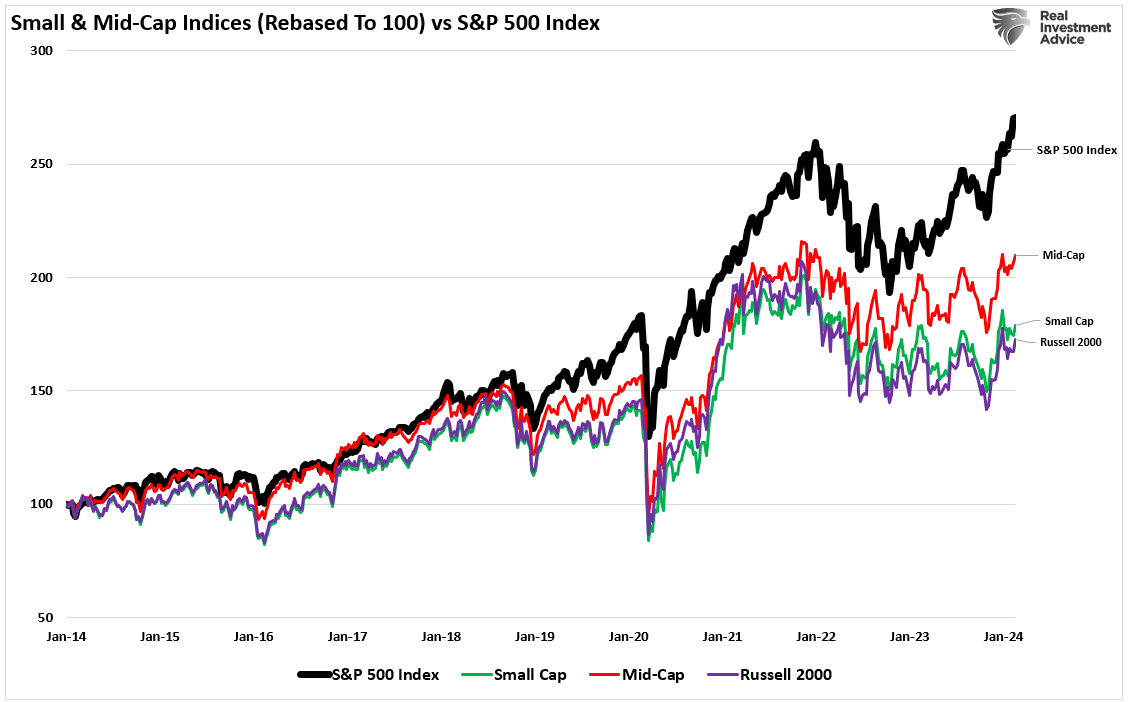
“The recent exuberance for small-cap equities is also unsurprising, given the long period of underperformance relative to the S&P 500 market-capitalization-weighted index. The hope of a “catch-up” trade as a “rising tide lifts all boats” is a perennial bet by investors, and as shown, small and mid-cap stocks have indeed rallied with a lag to their large capitalization brethren.”
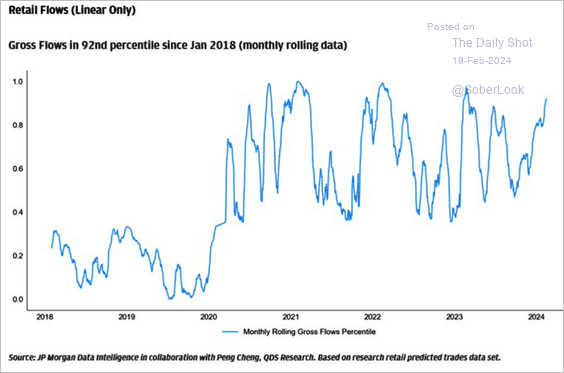
We see that exuberance in capital inflows into small-capitalization companies following the 2020 stimulus checks, which fueled an entire generation of “meme stock” traders on Reddit and the Robinhood app. The hopes for quick riches from a small-cap stock “going to the moon,” along with a lot of hype on social media apps, has increased the speculative craze.
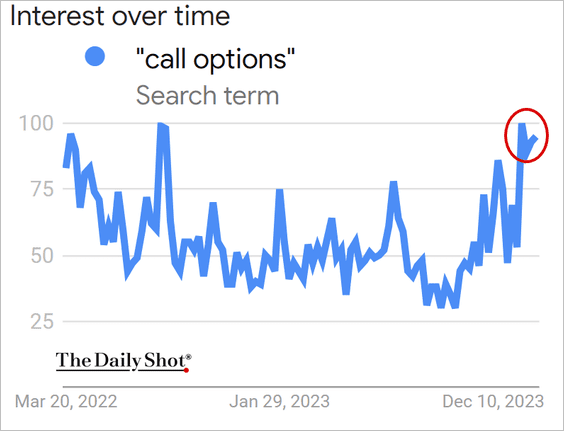
At the same time, to leverage their bets, these retail traders have piled into call options. The risk with speculative call options is they are either a “win” or a complete “bust.” Therefore, the speculative risk in trading options is dramatically higher than buying the underlying companies.
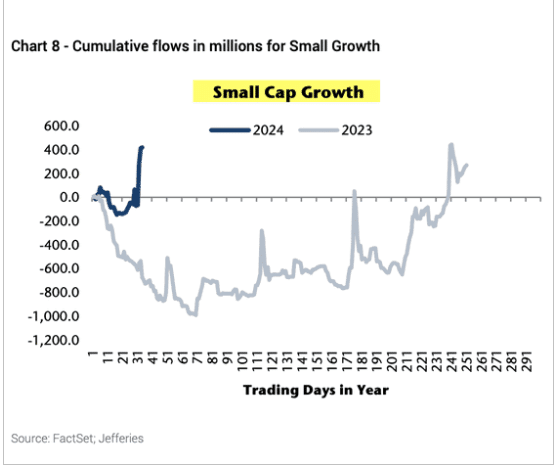
However, retail investors are directly piling money into small-cap stocks, as shown by increasing weekly inflows.
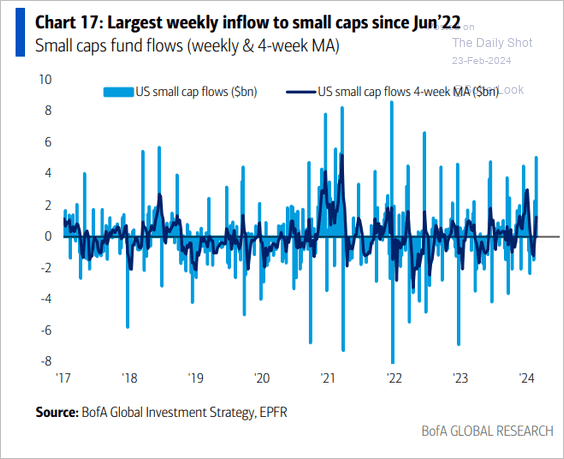
Particularly into small-cap growth stocks versus value, with a substantial acceleration starting in November 2023 and increasing in 2024.
As noted above, this degree of speculative risk-taking by retail investors has always ended badly. This is why the financial market considers retail investors as “dumb money.”
Of course, this brings us to whether investors are again making the same mistakes.
A Small Problem May Turn Out To Be Big
Over the past decade, the Fed’s ongoing interventions have led to a massive increase in the leveraging of U.S. corporations. Of course, with repeated financial interventions combined with a zero-interest policy, why would corporations increase the use of cheap debt?
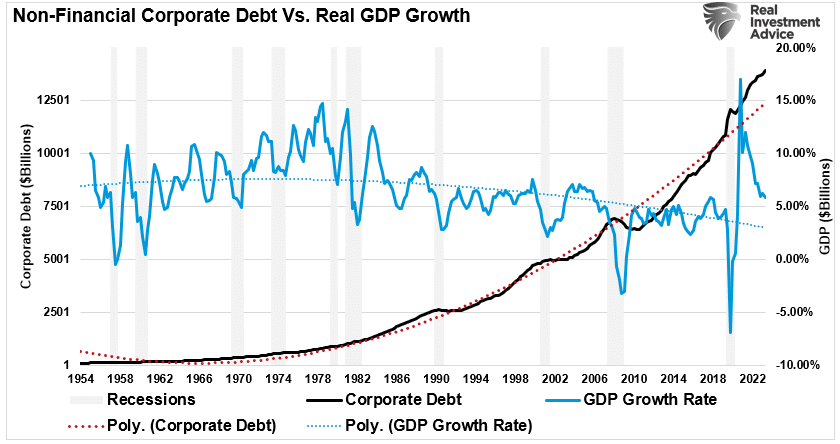
The increased debt load doesn’t provide an inherent risk for large capitalization companies with massive revenues. However, for small-cap companies, it is a very different story. Weaker economic growth continues to increase in the number of “zombie firms.” What is a “zombie” in the financial world? To wit:
“‘Zombies’ are firms whose debt servicing costs are higher than their profits but are kept alive by relentless borrowing.
Such is a macroeconomic problem because zombie firms are less productive. Their existence lowers investment in and employment at more productive firms. In short, one side effect of central banks keeping rates low for a long time is that it keeps more unproductive firms alive, which ultimately lowers the long-run growth rate of the economy.” – Axios
The chart below from our friends at Kailash Concepts shows the problem facing the “dumb money” crowding in small caps.
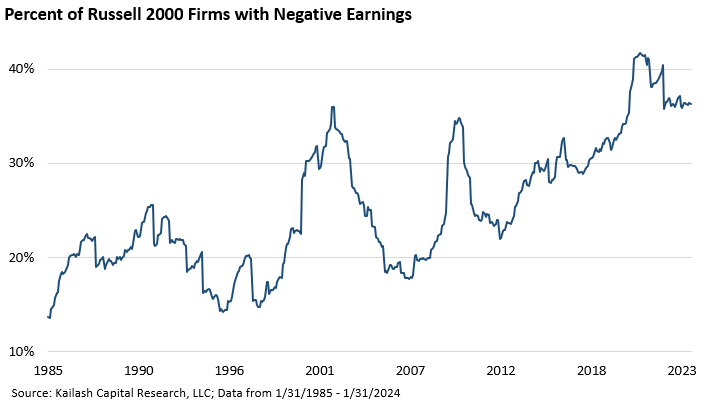
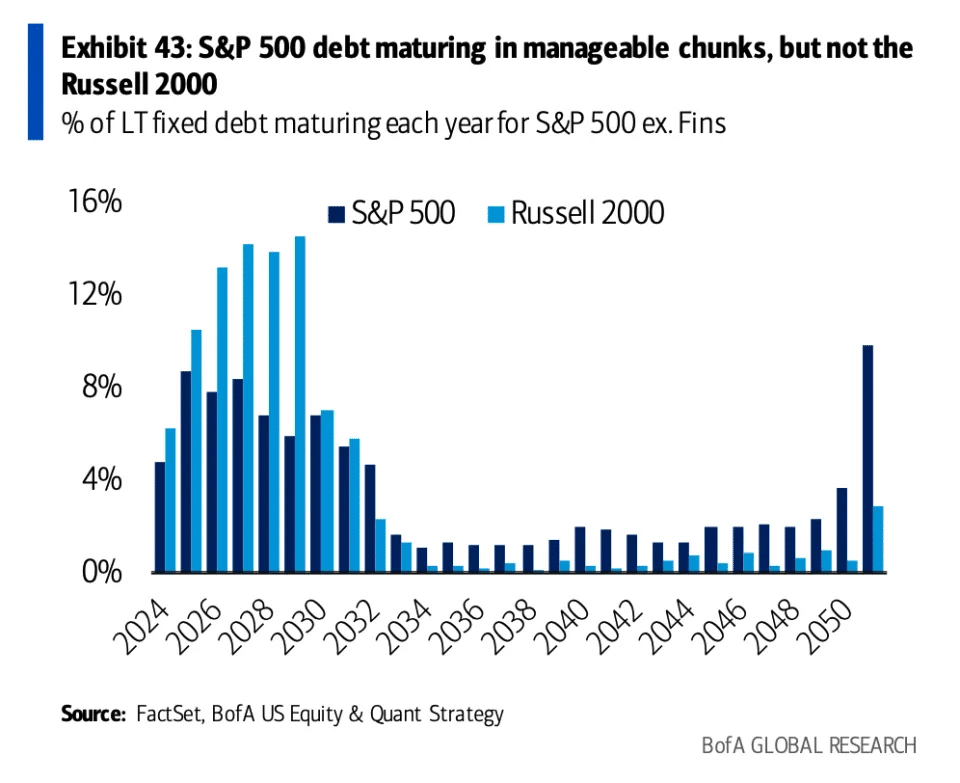
With nearly 40% of the Russell 2000 index sporting negative earnings, many have issued debt to sustain operations. Unlike many companies in the S&P 500 that refinanced debt at substantially lower rates, many of the Russell 2000 were unable. The risk is that if higher interest rates remain when that “debt wall” matures, such could further impair survivability.
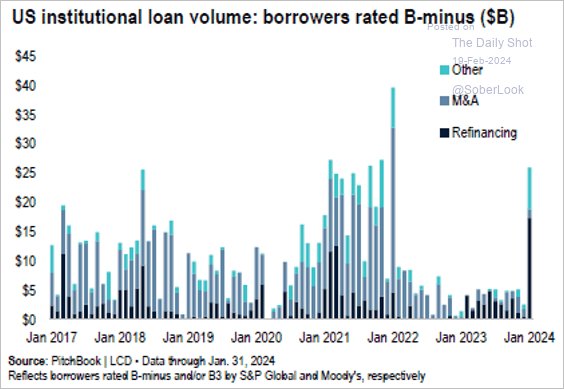
Interestingly, since the beginning of the year, we are seeing borrowers return to the market for refinancing. As shown, there has been a surge in B-minus (junk) rated borrowers, who are already taking on debt at higher rates to refinance old debt. While we are very early in the cycle, the risk to underlying balance sheets is rising.
As we concluded previously:
“There are risks to assuming a solid economic and employment recovery over the next couple of quarters. With consumers running out of savings, the risk of further disappointment in sales expectations will likely continue to weigh on small business owners. This is why we keep a close eye on the NFIB reports.”
At the moment, the “dumb money” is chasing momentum amid a bullish frenzy. Unfortunately, such will likely again prove disappointing when expectations eventually collide with fundamental realities.
Related: Stocks and VIX Warning Signals: What Investors Need to Know