
Trending

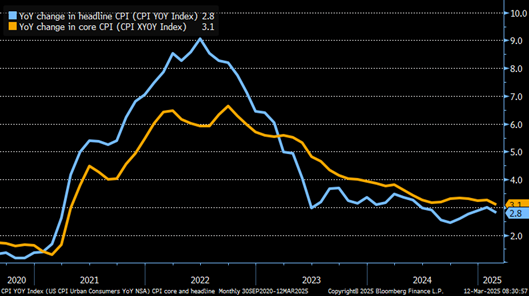
Following a hot January CPI set of inflation data, the BLS CPI report cooled down in February. Headline CPI rose +0.2% versus +0.3% consensus and +0.5% in January. Core CPI was also +0.2% for the month. The year-over-year headline and core rates fell 0.2% from last month’s figures to 2.8% and 3.1%. The 3.1% core CPI annual rate is the lowest since April 2021. As the graph below shows, the yearly CPI continues to decline, albeit at a sluggish pace.
Shelter prices remain stubborn, growing by 0.3% last month. While down from January’s 0.4% increase, it is still running well above real time rent and house price changes. The 4.2% annual rate for shelter prices will likely be cut in half or more throughout 2025.
Despite the good inflation news, bond yields rose slightly. At the moment, the risk-off market dynamic is the most significant factor driving all asset returns. This translates to the highest beta stocks and cryptocurrencies taking the biggest losses, value stocks outperforming the market, and bonds well bid. However, high beta stocks and crypto will likely lead the market higher when the trend reverses. Bonds may slip as investors and traders that rotated into them for safety are back to chasing risk. In the long run, this will have little impact on yields, but it appears the risk on – risk off mania will be a key driver in the short run. Long-term bondholders should ignore the daily gyrations and focus on the fundamentals, like inflation.
What To Watch
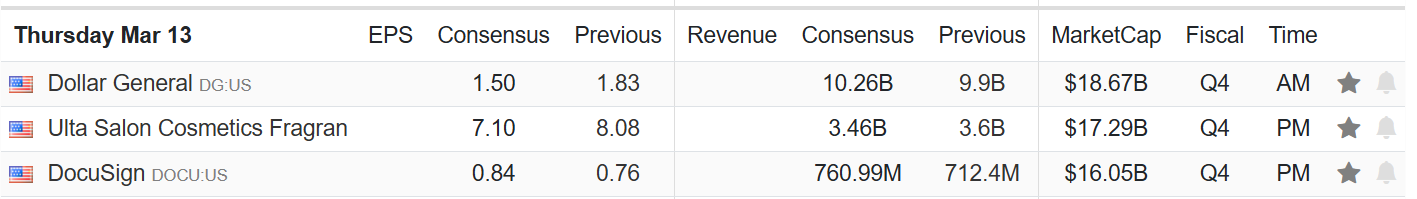
Earnings
Economy

Market Trading Update
As noted yesterday, the market is oversold enough for a reflexive bounce. However, as we specifically noted:
“Notably, while headlines are lit up with recession talk, this is not currently the case. It will take several months of data to determine if a recession is in the offing. However, while it may seem as if the recent decline is traumatic, it is just 9% from the peak and just a normal correction after a significant run from last August’s lows. The current technical damage will take some time to repair, so we are now in a “sell the rally” mode, as noted yesterday.”
The obvious question is where a “sellable rally” takes us, and what actions should we take next? I tweeted out the following chart before the market open yesterday, laying out three possible paths.
Path 1) The market rallies to the 200-DMA moving average, which is now broken support, fails, and turns lower. If that occurs, such would confirm a continuation of a larger corrective cycle and portfolios should be derisked quickly.
Path 2) The market rallies through the 200-DMA and back to broken support at the 50-DMA. Currently, this is the most probable path, as the confluence of resistance at the 50- and 20-DMA will challenge markets. A failure at this level would be unsurprising. Profits should be taken and portfolios rebalanced. A successful retest of the 200–DMA would provide a decent entry point to rebalance equity exposures as needed.
Path 3) While possible, this path seems the most unlikely given the current economic and earnings backdrop. However, if the market can muster enough buying power to push through all previous broken support levels, a test of all-time highs is likely. As with Path 2, profits should be taken and risk rebalanced until confirmation that the bull market is fully intact. Such would require a break out to new highs.
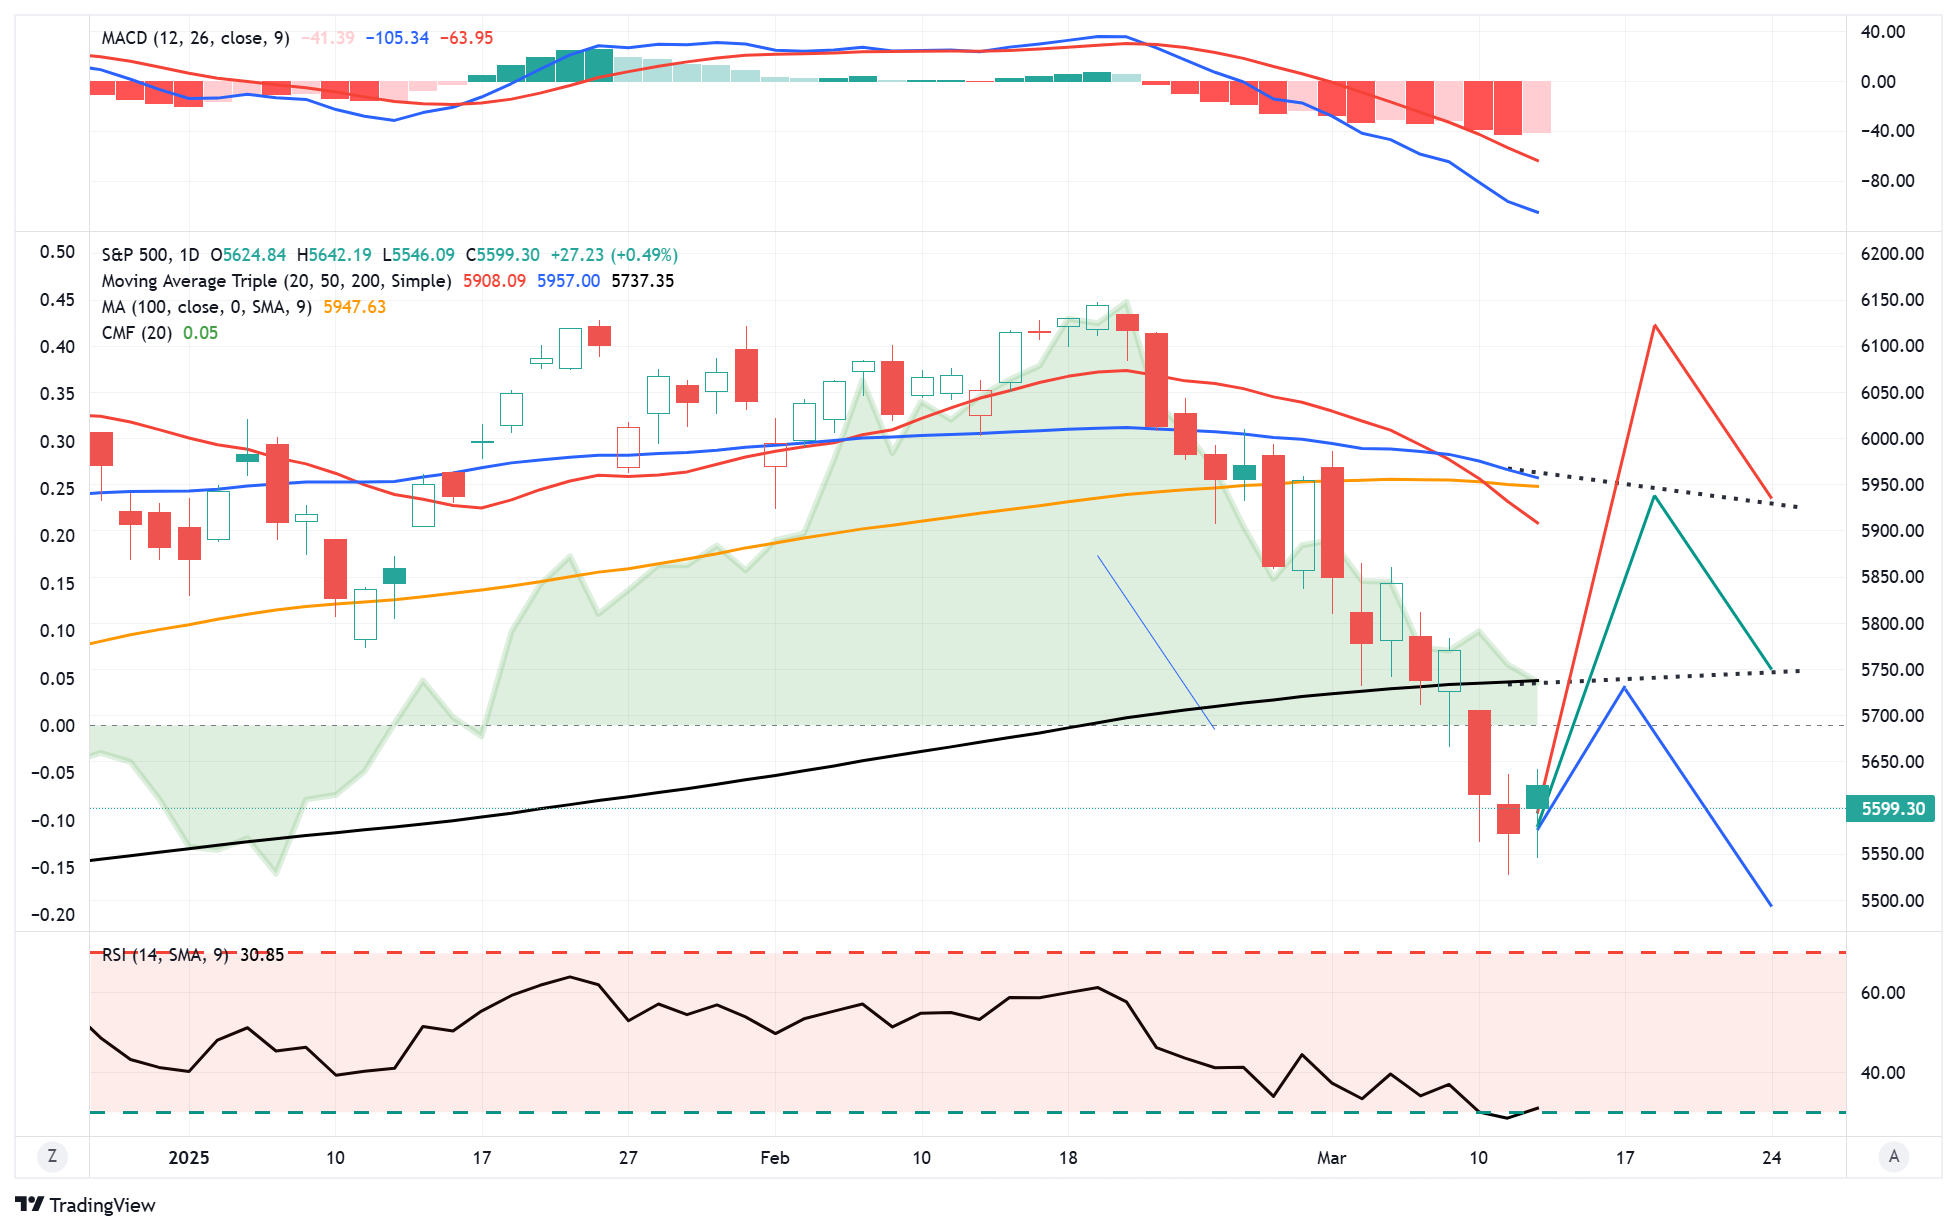
In all cases, while we recently added exposure to portfolios, our goal is to use any failed rally to reduce risk and rebalance allocations as needed. As stated, we are in a “sell the rally” mode until we have a confirmed signal the bull market has regained its footing.
Are Credit Spreads Blowing Out?
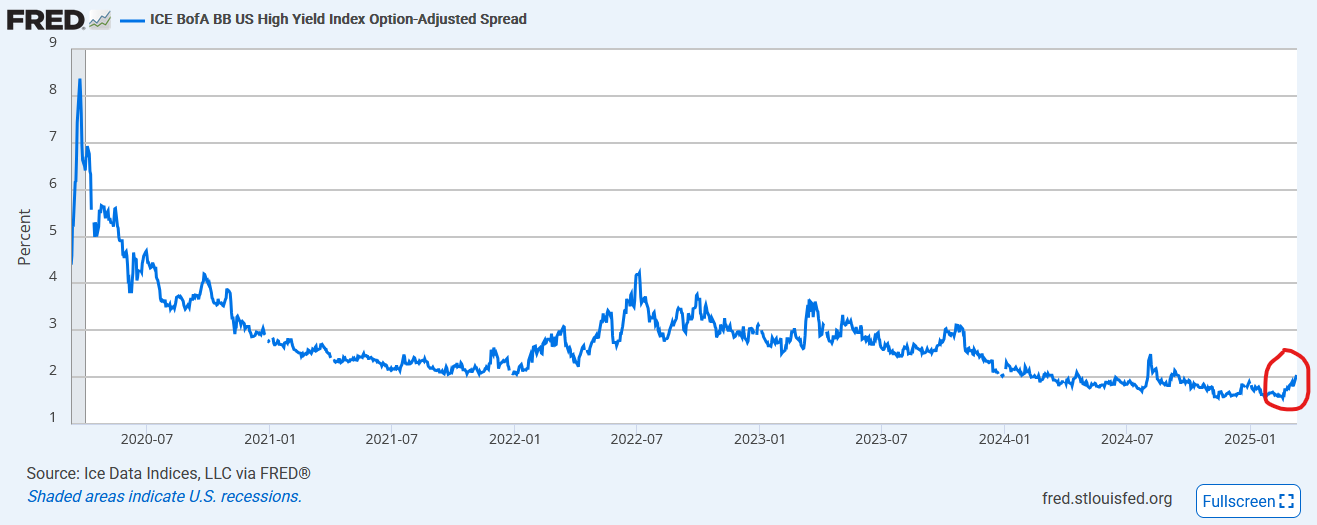
The screenshot below is silly. The tweet claims corporate yield spreads to U.S. Treasury securities are blowing out. The graph is misleading, as it only goes back to August 2024. The second graph of BB-rated yield spreads provides much more context as it spans five years. Yes, credit spreads have widened in the last few weeks. However, they are still near the lowest levels since 2020. Furthermore, while not shown, they are close to the lowest levels in the past 25 years. While credit spreads are a good indicator of the economy, liquidity, and broad risk tolerance, the recent upward move is not enough to cry wolf. That said, we are watching spreads more closely as the economy shows some weakness.

Tokenization: The New Frontier For Capital Markets
Here are the key benefits of digital tokenization:
- Better liquidity
- More transparency
- Around-the-clock market access
- Cost-effectiveness
- Fractionalization
- It makes capital markets more inclusive for funders and investors
- Enlarge the pool of investable assets
As judged by the benefits, digital tokenization is a significant upgrade from the current financial system. However, despite the promising outlook, the adaptation process is slow. For the token market to compete against traditional capital markets, more explicit regulations and a greater understanding and trust of the blockchain among retail and institutional investors and the government are required. Therefore, it will be incumbent on the government, financial industry, and investor alliances to form guidelines, regulations, and governance to help create a solid and trustworthy foundation.
The economic benefits of tokenization are massive. Financial markets for liquid and illiquid assets will be more efficient, cheaper to fund and transact in, and less exclusive. If tokenization takes off as we think it can, the benefits could be substantial for the capital markets, but much more importantly, the economy and the nation’s populace.

Tweet of the Day
“Want to achieve better long-term success in managing your portfolio? Here are our 15-trading rules for managing market risks.”
Related: Tokenization: The Future of Capital Markets Is Here