

Trending

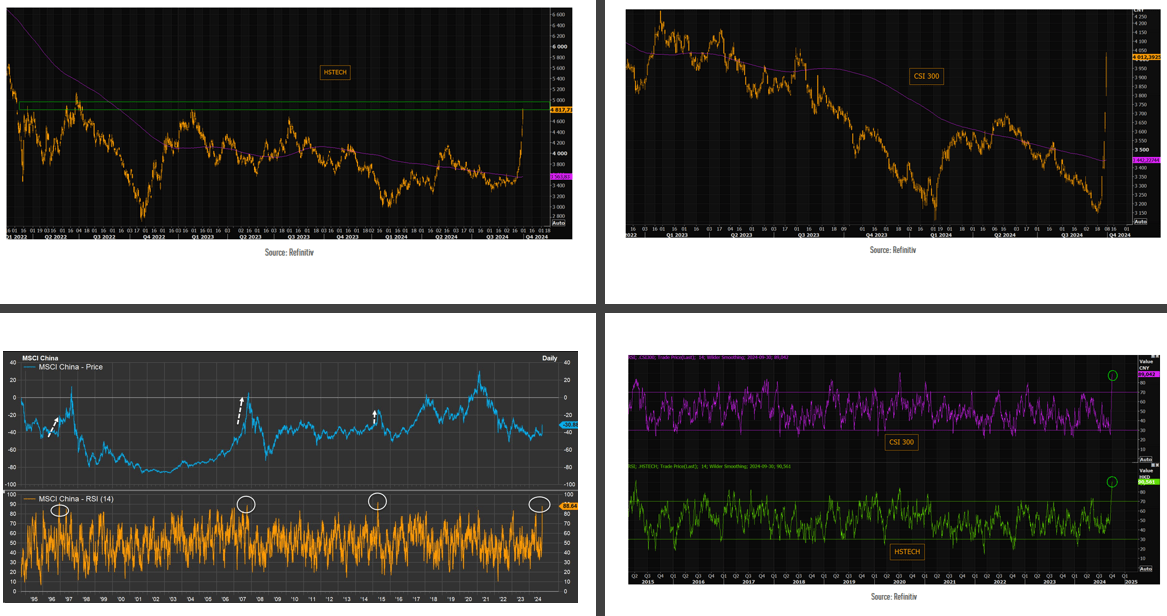
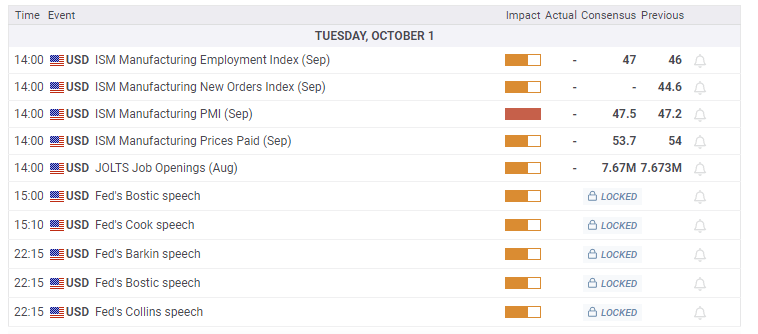
Over the last month, China has injected its economy with an incredible amount of monetary and fiscal stimulus, which has resulted in extreme optimism in its stock market. As we share below, the Hang Seng Tech index and the broader China stock market CSI 300 index are up 30-40% over the last few weeks. The lower graphs show that the technical indicators of the two indexes are very oversold. As shown on the bottom left, the China CSI 300 index RSI is approaching a significant peak, which was also associated with extensive stimulus plans in the past. Prior instances have accompanied a boom-bust scenario for Chinese stocks.
China has the world’s second-largest GDP at $18 trillion. It dwarfs the next largest economies, Germany and Japan, around $4 trillion each. Accordingly, given their size, U.S. and global investors must appreciate the possibility that China’s massive liquidity will work its way into stock markets worldwide. Also, this round of stimulus aims to boost private consumption. China’s citizens consume much less per capita than U.S. citizens. The global economic effects could be substantial if they successfully boost personal consumption. However, we caution that China has many structural impediments to growth. As such, it’s far from certain that this time will differ from economic revival efforts in the past. Thus, this round of stimulus’s global economic and financial effects may be minimal.
What To Watch
Earnings

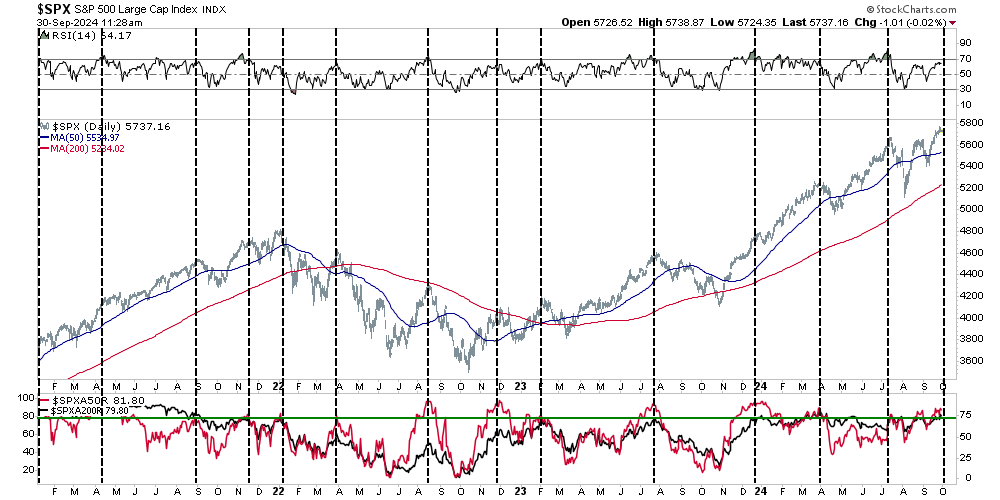
Economy
Market Trading Update
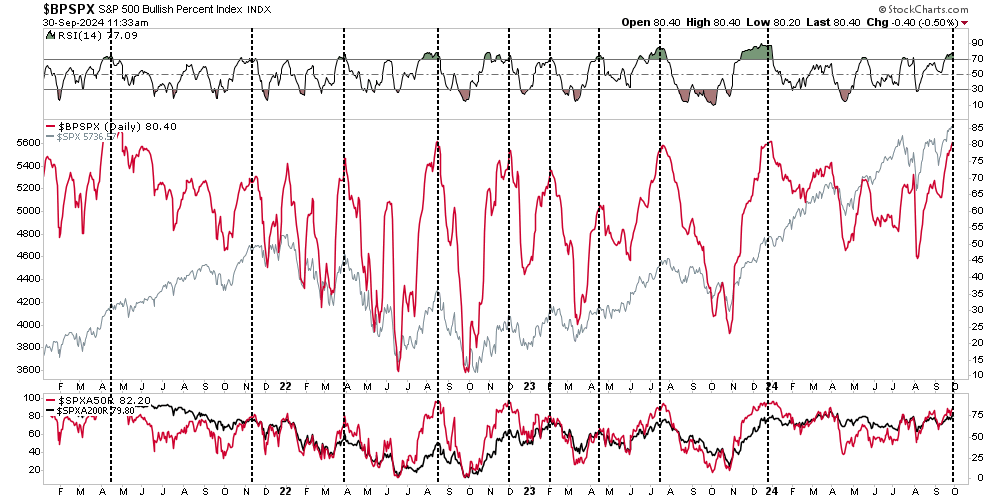
Yesterday, we discussed the bullish “cup and handle” formation in the S&P 500, giving us a year-end target of roughly 6000. While the price action of the S&P 500 is bullish, we must consider some short-term concerns. The bulls have been discussing the rising “breadth” of the market, which is indeed bullish when breadth is low and recovering. Improving breadth provides the “buying” power to drive the market higher. However, much like relative strength and momentum indicators, most buyers have likely bought when breadth reaches very elevated levels, leading to a short-term correction or consolidation.
The number of stocks trading above their respective 50- and 200-DMAs is at historically high levels. While such elevated levels do NOT mean a correction is imminent, they do suggest that further upside, without some corrective action first, is likely limited.
We see the same with the number of stocks trading with “bullish buy signals.” As shown, when the percentage of stocks with “bullish buy signals” is elevated, combined with elevated Relative Strength readings and high levels of “breadth,” such has typically preceded short-term corrections and consolidations.
While we expect the market to trade higher into year-end, given the current momentum and bullish sentiment, a pullback to support would be unsurprising given the short-term overbought and bullish conditions. With the election in just a month and earnings season kicking off this week, we suggest some risk management until these conditions are resolved.
The You Are Here Moment
The following summary of Jim Colquitt’s latest commentary comes via Substack. To read his entire Weekly Chart Review, visit Jim at jimcolquitt@substack.com.
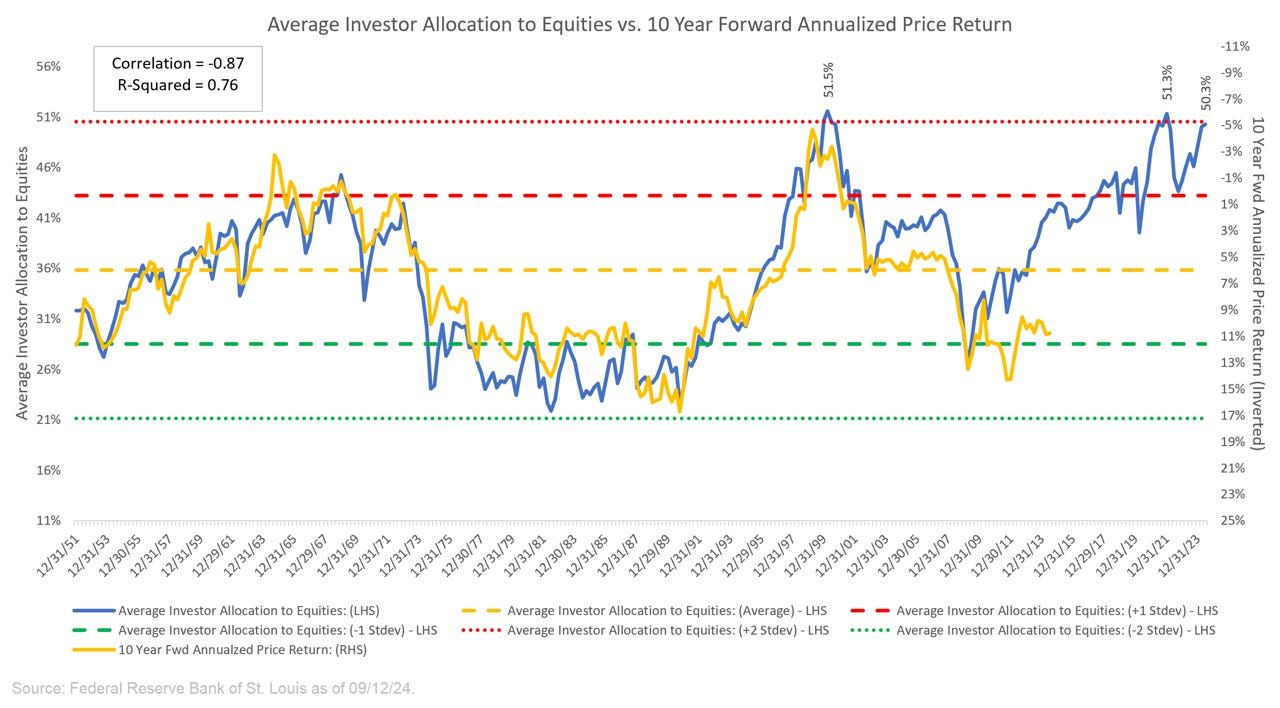
The first graph below charts the average investor allocation to equities and the 10-year return that followed. He writes:
The current quarterly value for the “Average Investors Allocation to Equities” chart above is 50.3%. This value has only been exceeded 5 other times in almost 75 years’ worth of quarterly data points.
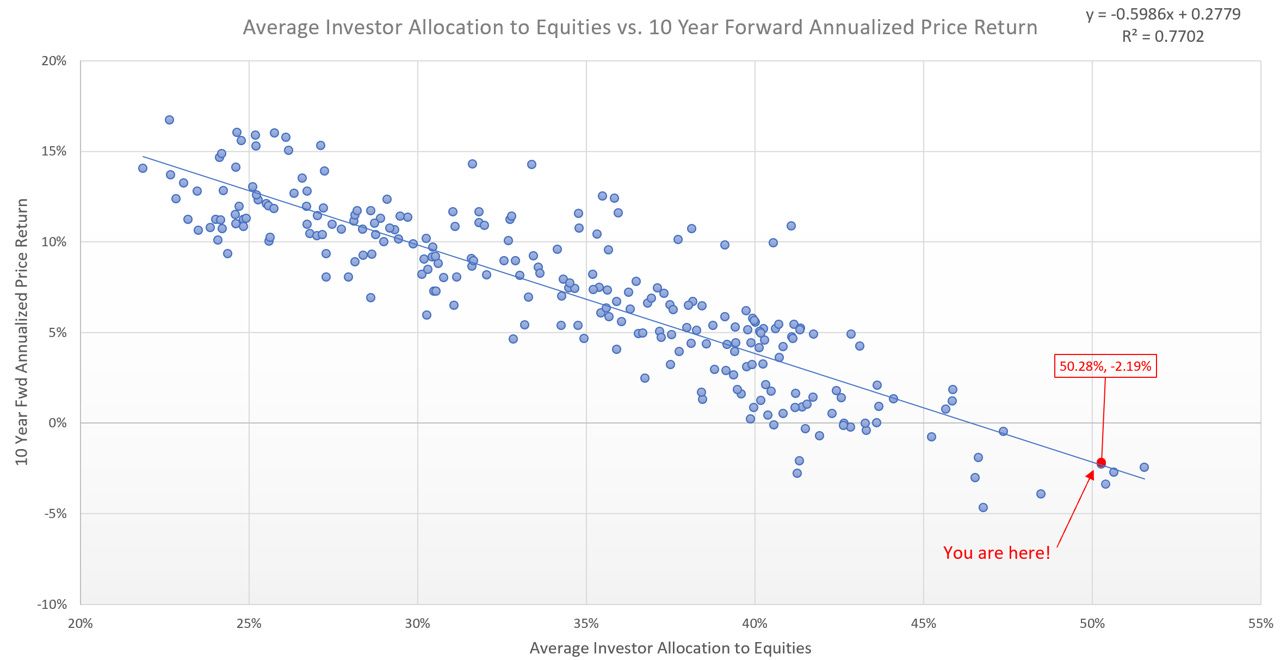
His second graph shows the robust correlation between investor allocations and ensuing returns.
The “You are here!” value is typically not the starting point for extended bull markets.Instead, the linear regression scatterplot suggests that from this starting point, we should expect a -2.19% annualized return over the next 10 years for the S&P 500.
While Jim’s comments and graphs are concerning, timing is crucial. They do not account for the timing of peaks and troughs over the next ten years. For instance, stocks could rally for three more years yet perform poorly over the next seven and return -2.19% annually. Jim ends his message as follows:
Risk assets are still in rally mode and I don’t think you want to fade that before the election but be careful not to overstay your welcome once the election is behind us.
Emerging Markets Lead The Way
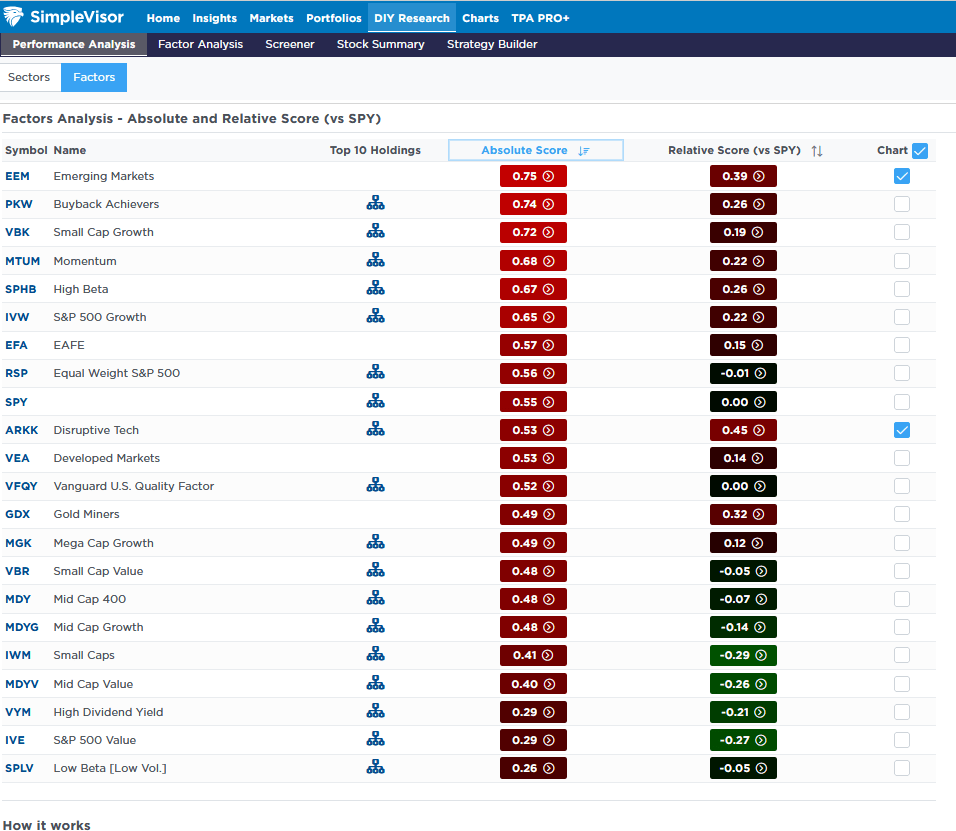
The following tables from SimpleVisor show that the emerging markets ETF (EEM) far outpaced the other stock factors last week. About a third of EEM’s holdings are Chinese stocks. The sectors and factors, in general, continue to show healthy market breadth, although the absolute scores are starting to get high, potentially portending a short-term pullback.

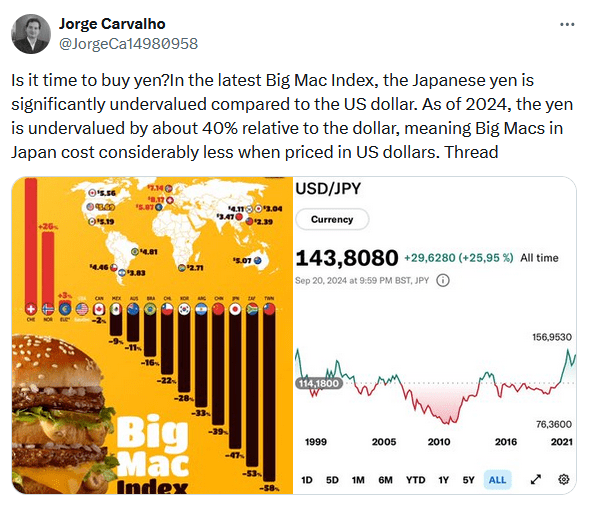
Tweet of the Day
“Want to achieve better long-term success in managing your portfolio? Here are our 15-trading rules for managing market risks.”
Related: Lessons for the US from China’s Balance Sheet Recession