
Trending

“Do you have faith the “new era” of Fed-managed markets can continue to levitate stocks well above historical norms?” – Is A Stock Market Crash Like 2000 Possible?
Most investors have no idea that the most considerable risk to their portfolio occurs if the Fed cannot continue to be a market magician. The next market crash will likely be the result of a Fed error. Do you have an investment playbook in case such an event unfolds?
In the article, we write: “Assuming the regression holds, and history has favorable odds of that occurring, we should expect the S&P 500 to fall to 2650 in the next two years.” That is the potential risk facing investors if the Fed fails to provide enough market liquidity.
If you worry about the Fed’s ability to keep stocks elevated and the next market crash, we revisit the investment playbook for surviving and thriving the tech bust of 2000. While times are certainly different today versus two decades ago, the analysis helps us consider an alternative investment plan in case the Fed can’t come to the market’s rescue when needed.
But first, what might cause the Fed to stop liquidity taps from flowing?
The Fed Is Running Out of Excuses
Persistent inflation is the biggest risk facing investors. By this, we mean that persistently high inflation is increasingly likely to result in reduced Fed accommodation for the markets.
The Fed has two congressionally chartered mandates in which to manage monetary policy. The first is maximum employment, and the second is price stability. The labor markets are arguably back to full employment, as we discuss below. Prices are far from stable and in need of the Fed’s attention.
Labor Markets
In What a Rate Hike in 2022 Might Mean For “Stonks” we show the labor markets are at or near maximum employment. Consider the following quotes from the article:
- The popular U3 Unemployment Rate, at 4.6%, is only 0.2% above the average of the five years preceding the pandemic.
- The U6 rate is 0.4% below the average of the five years leading to the pandemic.
- The graph below shows there are 1.7 jobs available for every person that lost a job during the pandemic.
- The labor market is fully recovered for those willing and able to work. The Fed has met its mandate.
Since writing the article, the U3 fell to 4.2%, and the U6 is now .9% below the last five years’ average.
The only indicator showing weakness in the labor markets is the labor participation rate. We argue that lower participation is not necessarily a weakness. As we write in the article: “While difficult to quantify, when adjusted for voluntary actions, like those above, the participation rate is likely back to where it was before the pandemic.”
If it isn’t already, the labor market is close enough to full employment that it should no longer be an excuse to continue with QE and not raise rates.
Price Stability
The Fed informally updated its price stability policy over the last few years. The new inflation averaging regime will allow inflation to run higher than 2% for short periods to compensate for prior periods when it was below average.
The graph below shows the three-year average inflation rate is now 2.7%. Further, the annual inflation rate is 6.2%. The current inflation rate and longer-term average rate substantially exceed the Fed’s price stability target.
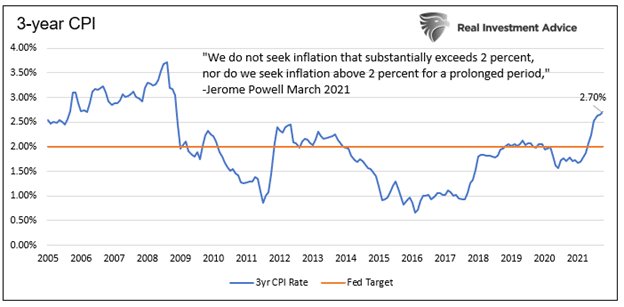
The Fed is grossly failing in its mandate for stable prices. In combination with full employment, the Fed is behind the eight ball, needing to taper quickly, raise rates, and importantly reduce liquidity.
Jerome Powell is finally acknowledging the points above.
On November 30th he stated: “At this point, the economy is very strong and inflationary pressures are higher, and it is therefore appropriate in my view to consider wrapping up the taper of our asset purchases, which we actually announced at the November meeting, perhaps a few months sooner,”
Do you have a game plan if the Fed aggressively reduces liquidity?
The Tech Boom/Bust Playbook – Value versus Growth
For over the past 60 years, value stocks have tended to outperform growth stocks. We have written a series of articles detailing the history. We suggest reading The Future Promise of Value Versus the Allure of Growth. For background on the topic.
While decades of history claim value outperforms growth, the recent decade argues otherwise. The graph below charts the ten-year annualized compounded return of the top and bottom decile of stocks ranked by the ratio of earnings to price (E/P). E/P is the opposite of price to earnings. Therefore, a stock with a high E/P is considered a value stock and not a growth stock as P/E signals.
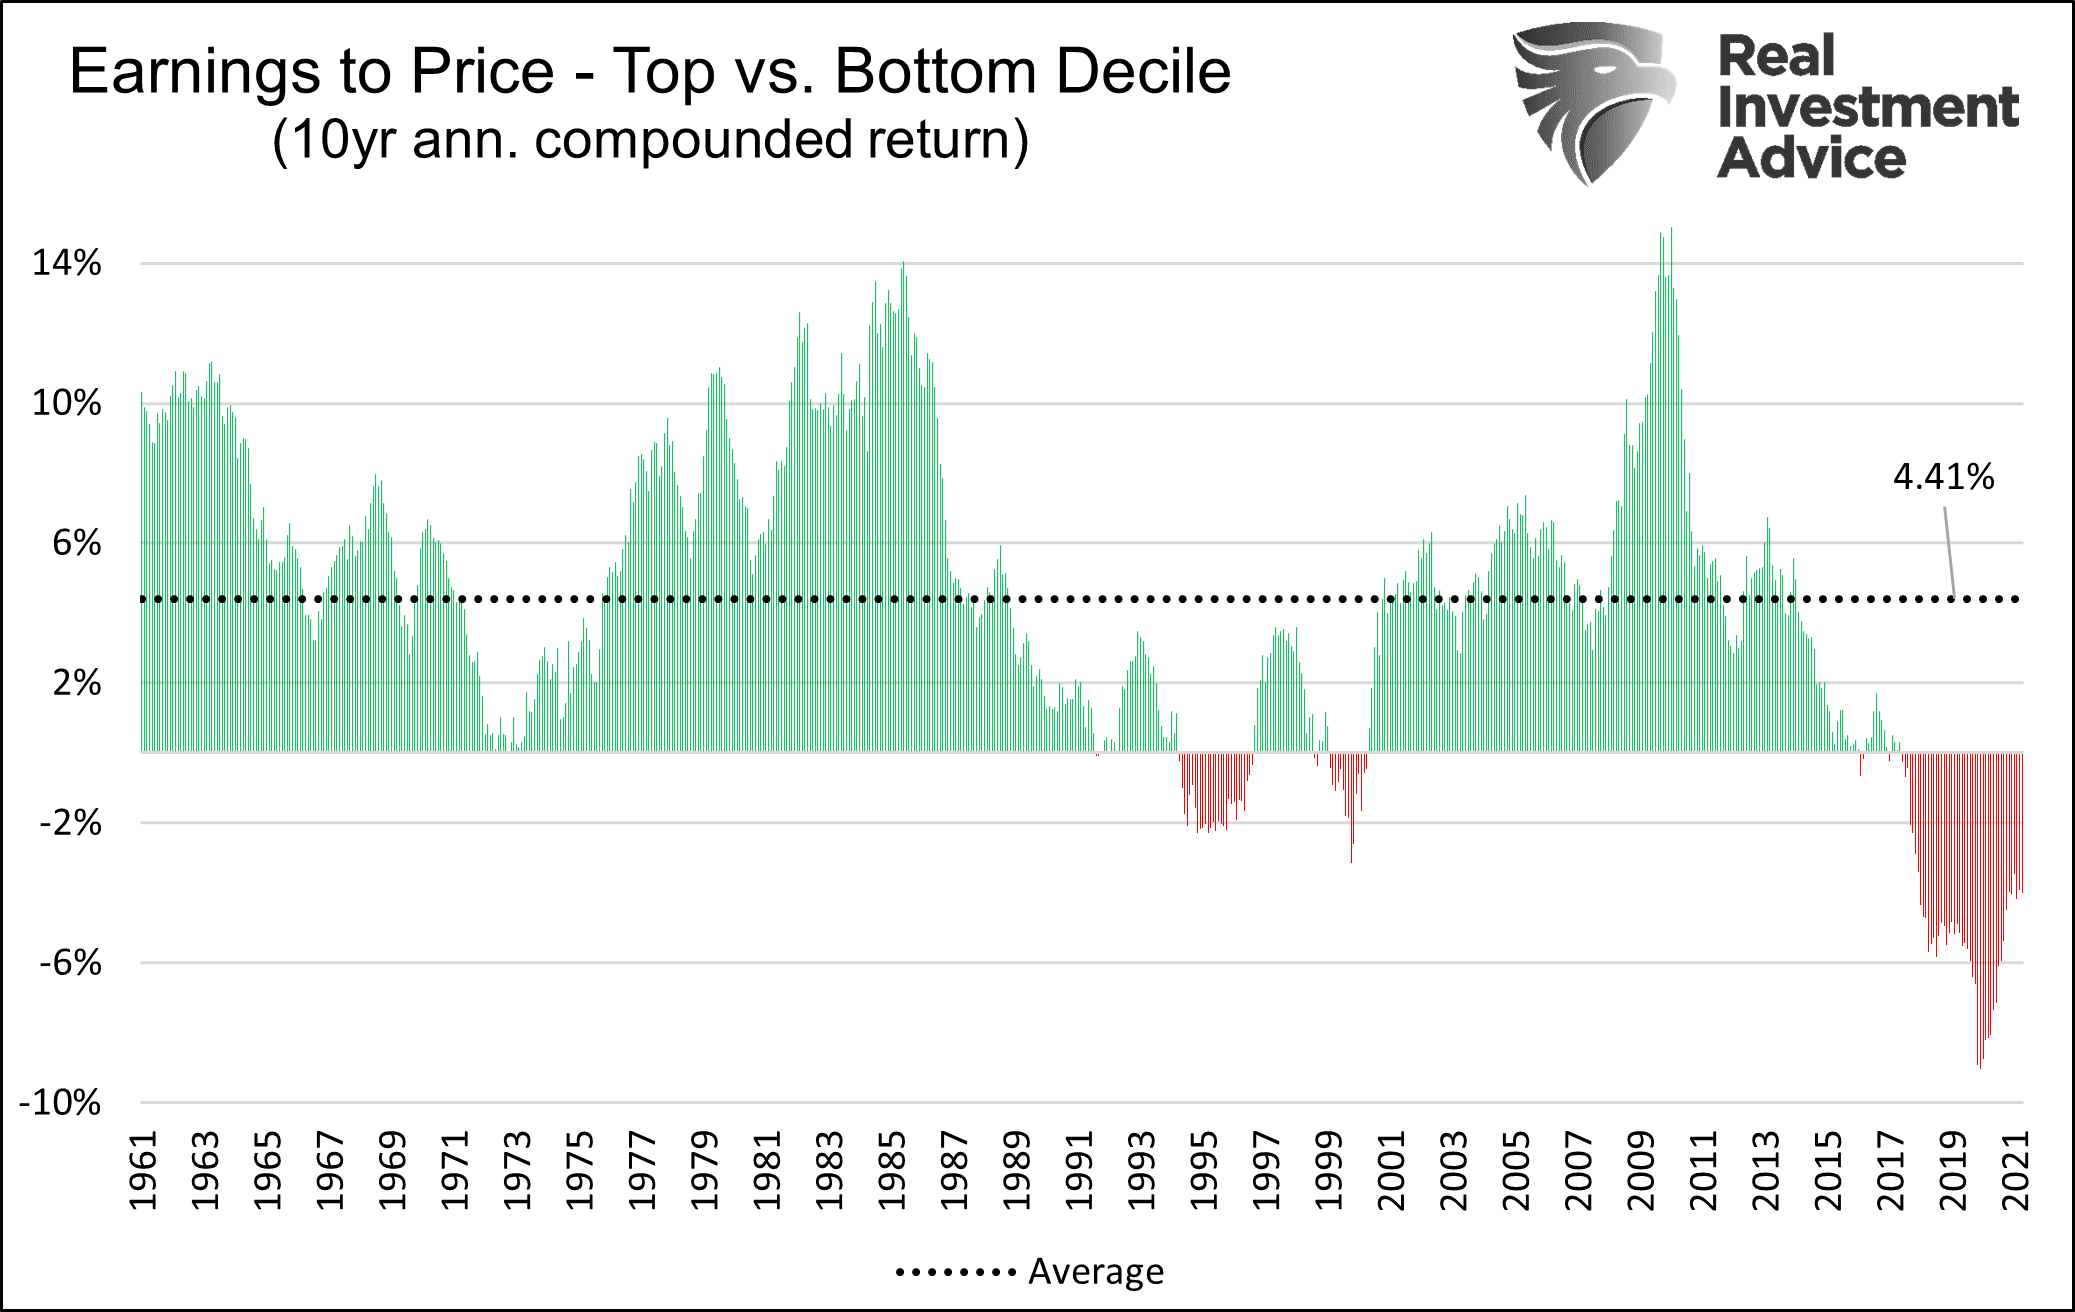
Since 1961, value has handily beat growth by 4.41% per year on average. However, as you likely notice, there are two periods such was not true, the mid-late 1990s and the last five years.
The following graph zooms in on the performance of growth and value in the years leading to the tech crash of 2000. The lowest decile of E/P stocks, growth stocks, outperformed value by 112% from 1998 to the tech crash in March 2000.
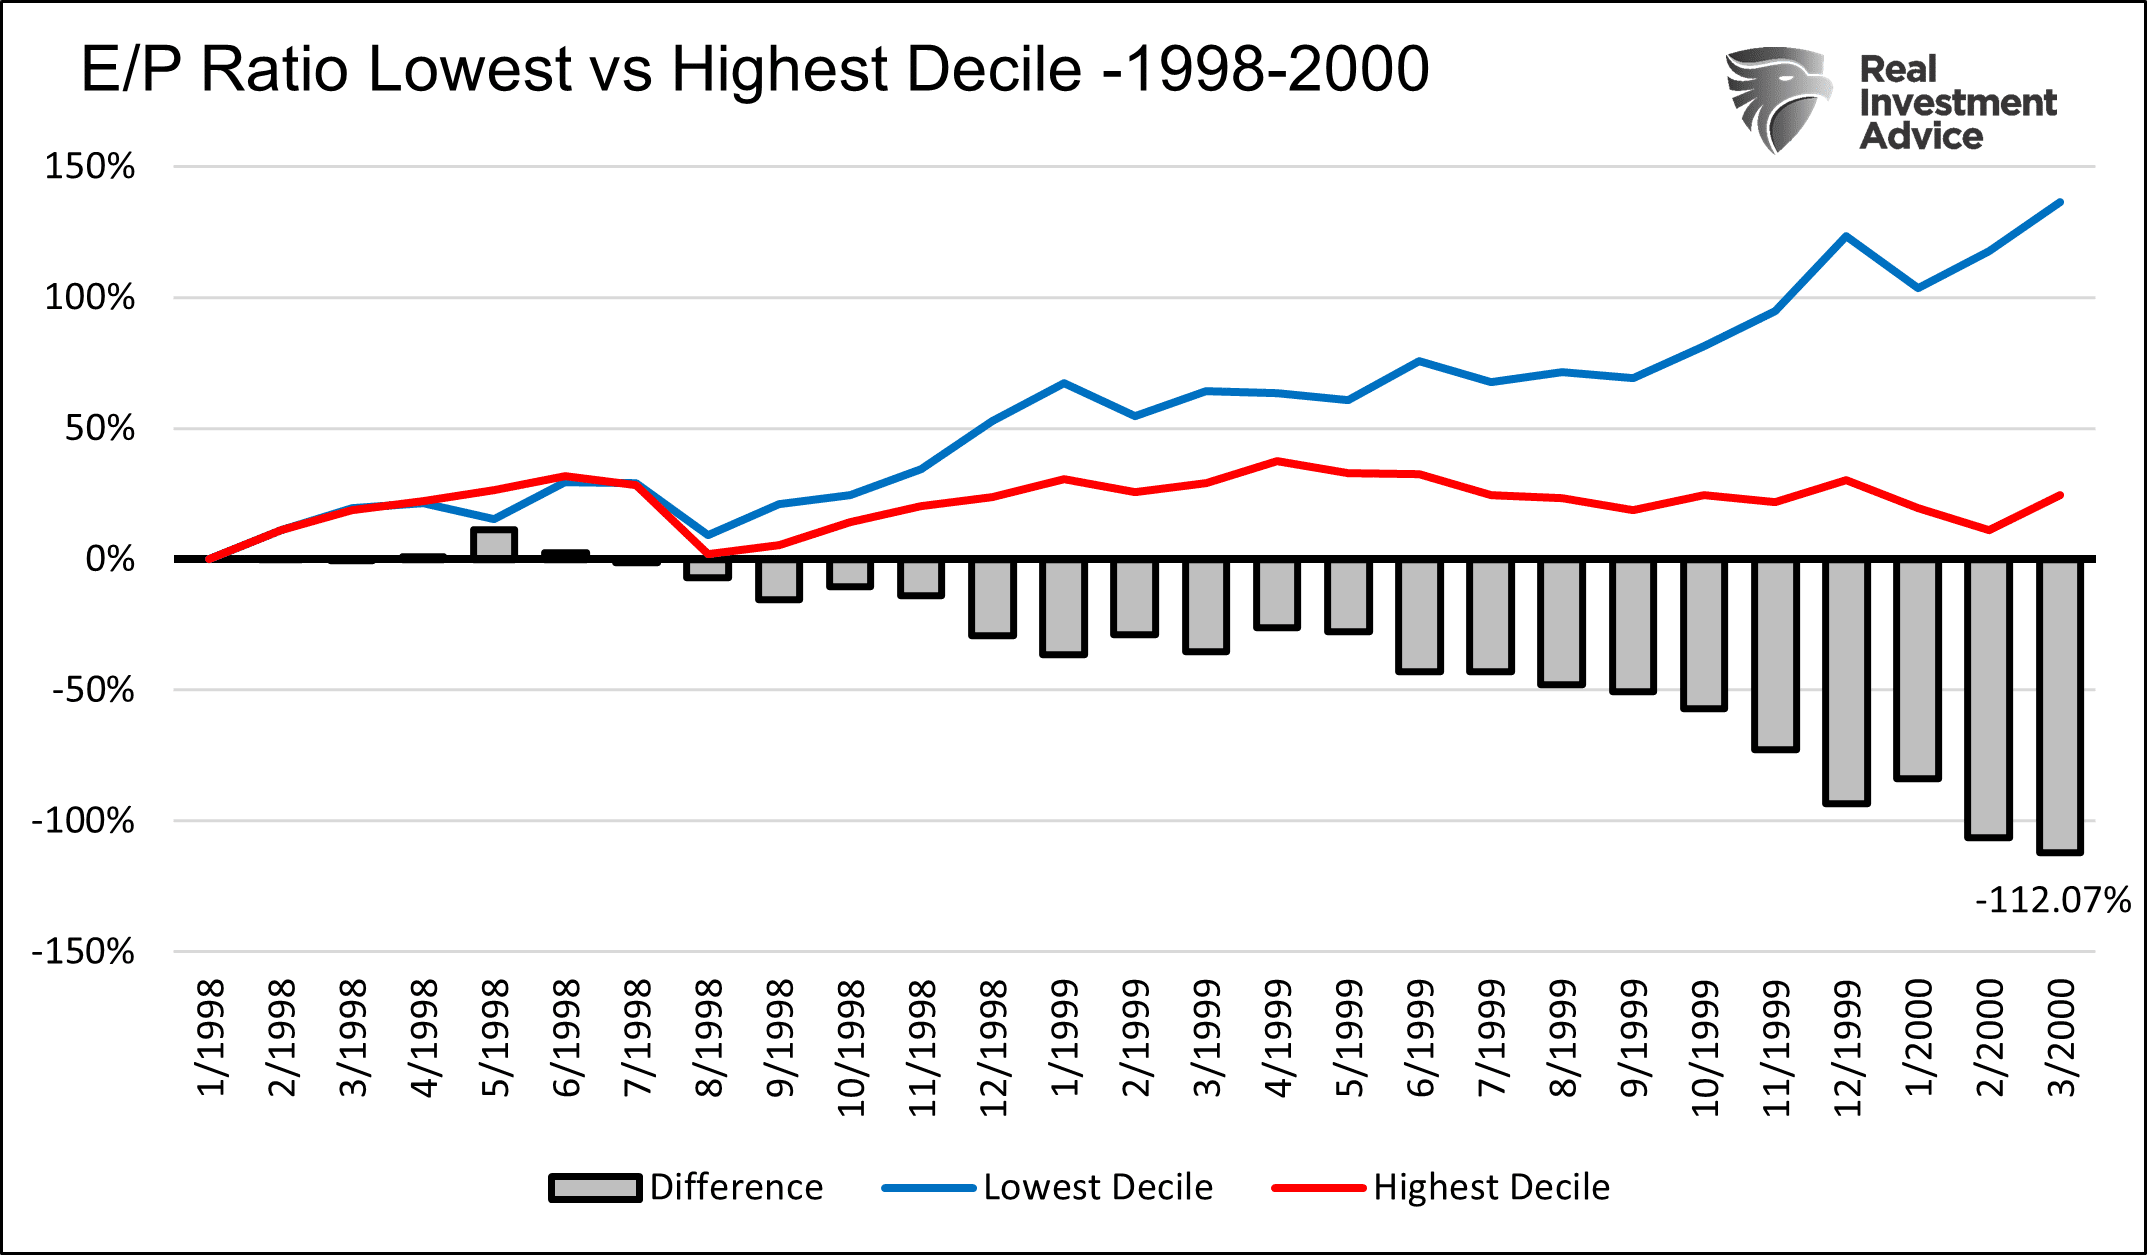
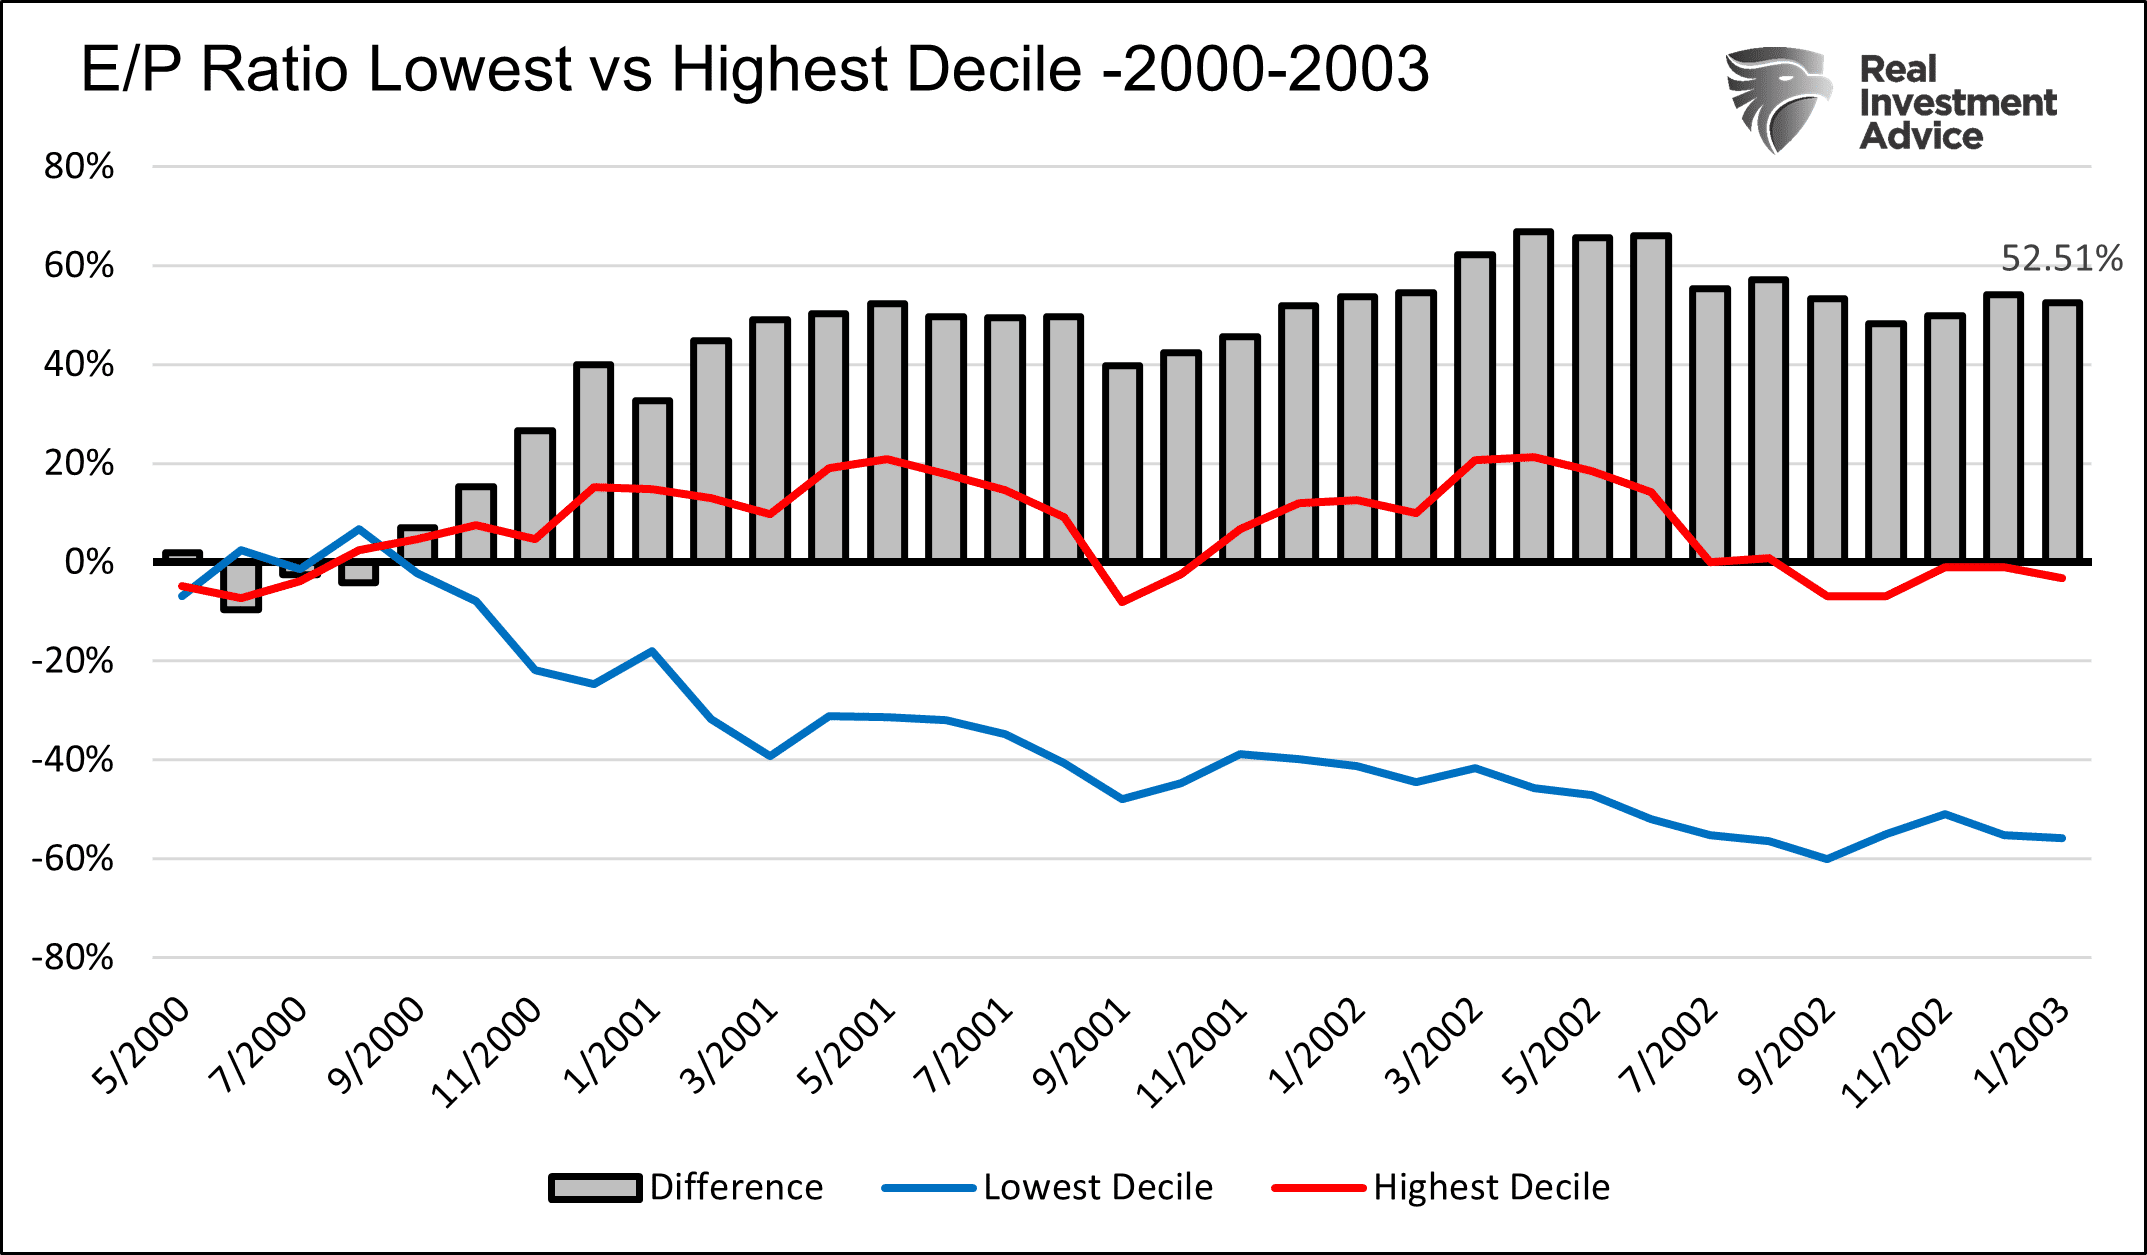
While growth had a great run in the late 90s, value stocks were the place to hide during the tech crash. As we show below, growth stocks gave up a large chunk of the late 90s gains. Value stocks were flat over the period, holding onto their gains from the prior few years.
Today
In Is A Stock Market Crash Like 2000 Possible? We write: “Not only is today’s speculative environment eerily similar to the late 90s, but valuations, in many cases, are frothier than that period.”
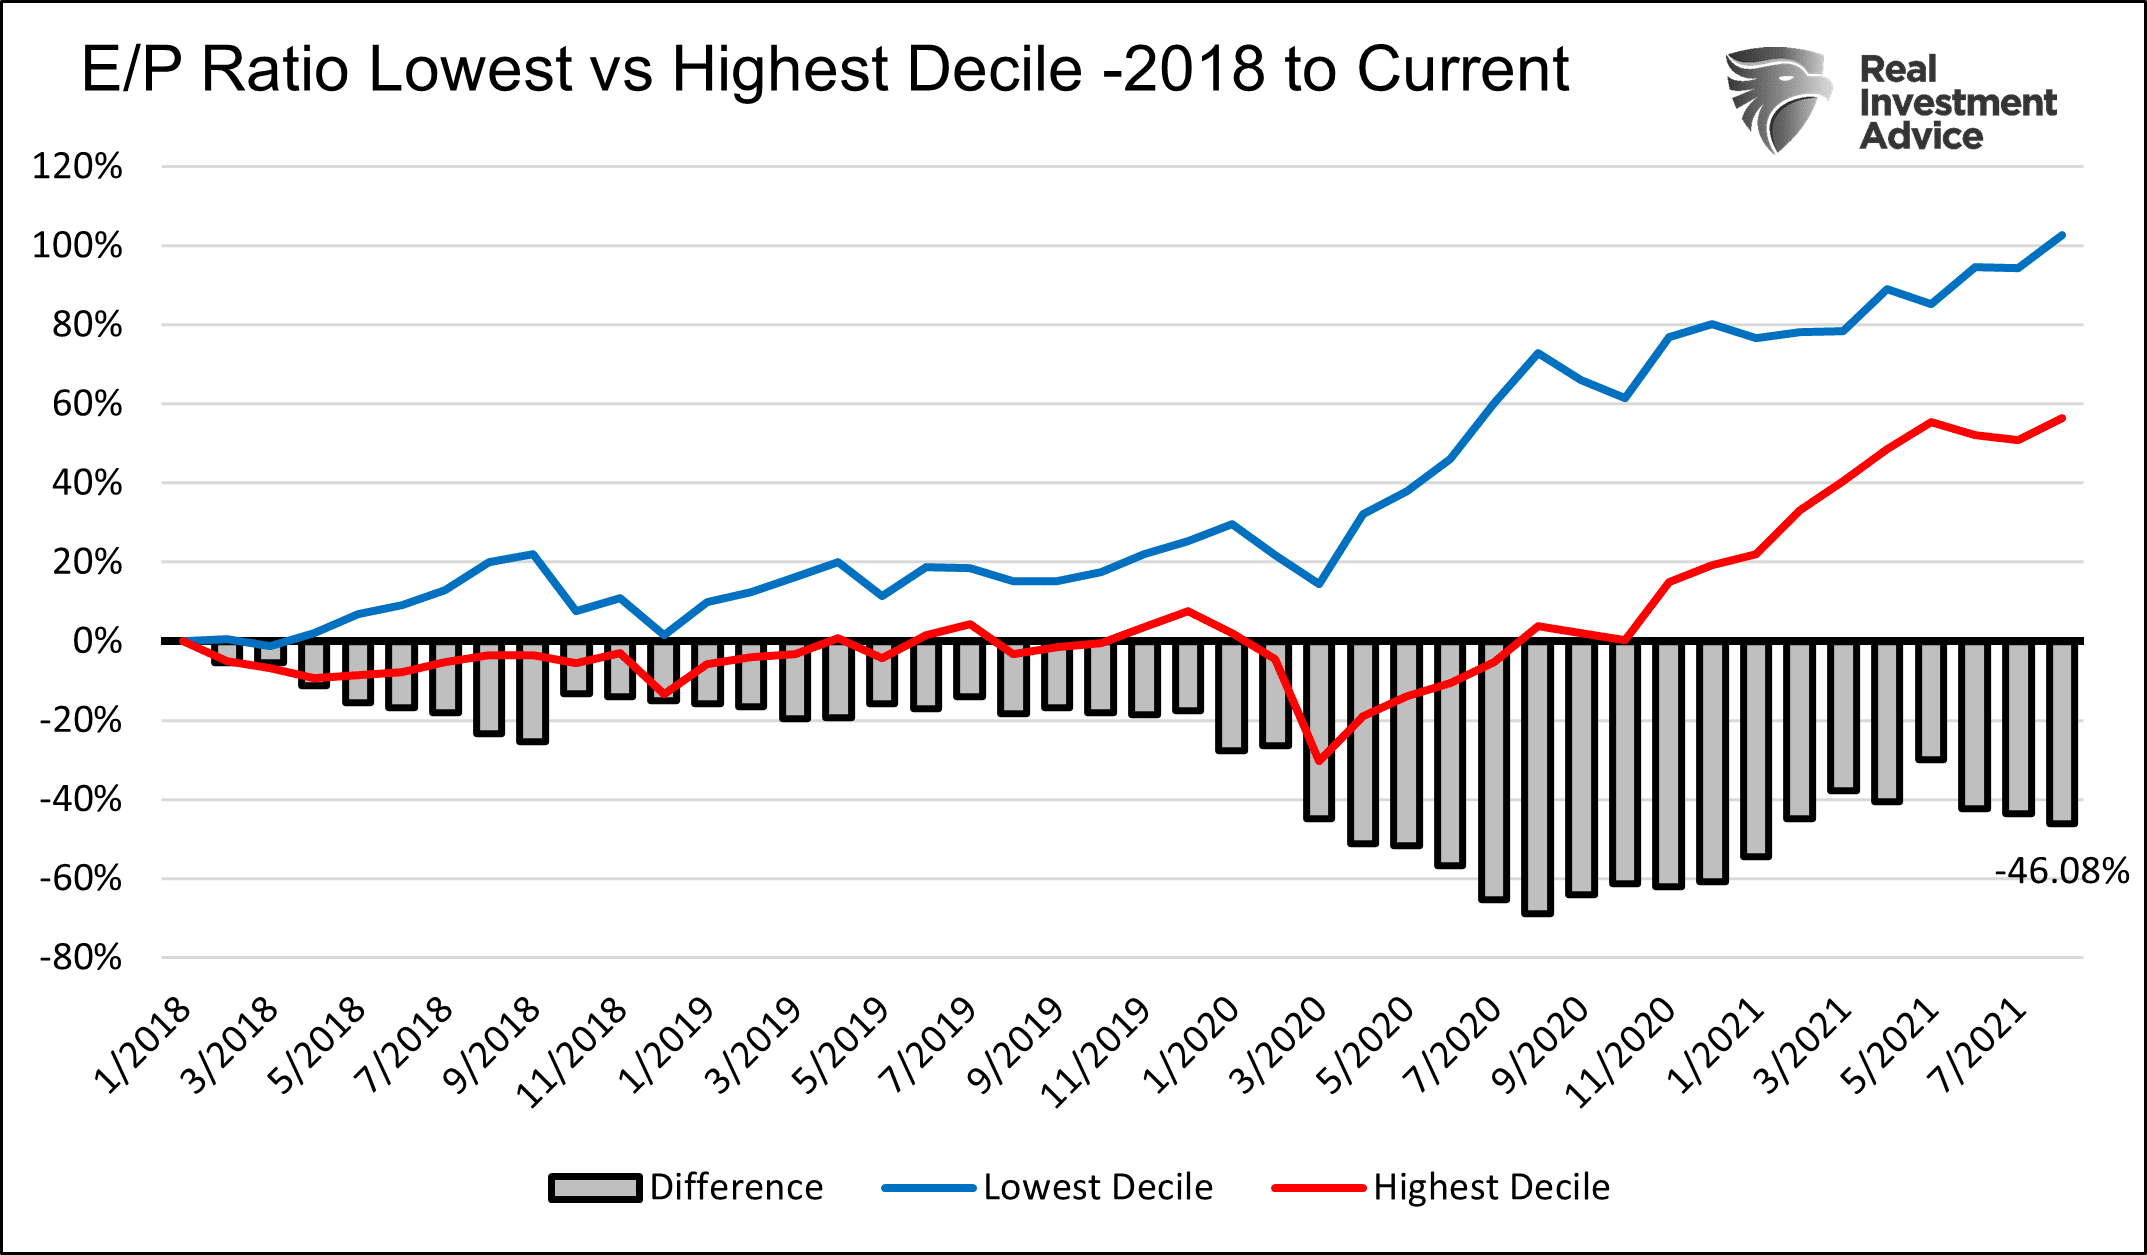
Like in the 90s, value is being shunned for growth. The graph below shows the most expensive stocks have beat the cheapest stocks by nearly 50% since 2018.
The economic, political, and demographic environments today versus 20 years ago are different. Despite the differences, there are similarities in market behaviors. One such parallel is that value is suffering at the hands of growth stocks.
We think it’s likely that value stocks will significantly outperform growth stocks in the event of a sizeable drawdown. Timing the transition from growth to value will be difficult, but such a rotation will likely prove invaluable. You may want to keep the 2000 investment playbook handy.
Summary– Investment Playbook
Leading to the tech bust, the narrative behind record valuations was grand expectations for a new internet era and outsized economic growth. Today, it is not the future enamoring investors but historically low interest rates and QE. It is the Fed’s actions exciting investors, not the potential of exceptional earnings.
The Fed is at the point it much combat inflation. To accomplish said task, they remove liquidity from the markets. How well they thread the needle by keeping asset prices stable and completing their task remains to be seen.
The Fed may find a way to keep equity valuations at sky-high levels even when removing liquidity. They may not, and in that case, we suggest you have an investment playbook ready to enact.