
Trending

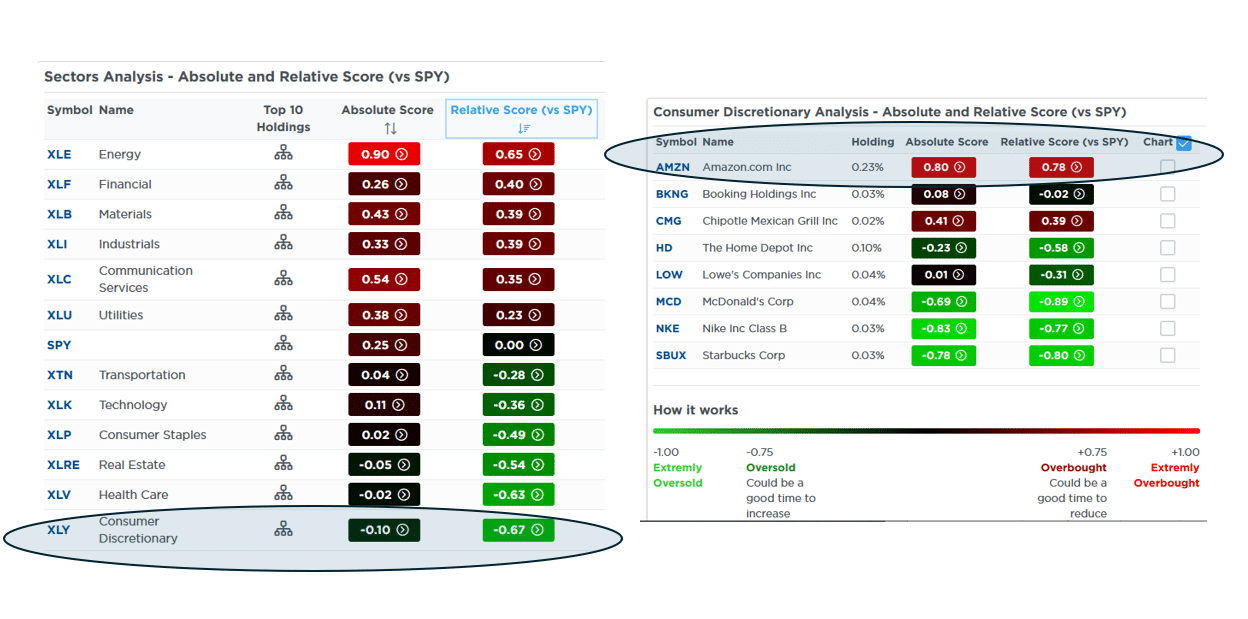
Amazon stock accounts for 25% of the Consumer Discretionary sector (XLY), and it has been up 23% year to date. However, as represented by XLY, the sector is barely eking out a 1% gain for the year. The SimpleVisor proprietary Relative and Absolute analysis on the left highlights that the sector is the most oversold sector on a relative and absolute basis. The screenshot on the right shows our Absolute and Relative sector scores for the top ten holdings of the sector. While Amazon is extremely overbought compared to S&P, most of the remaining discretionary stocks are grossly underperforming the index.
The data makes us question just how confident investors are in the economy. And at the same time, it presents another view of how the largest market cap stocks, like Amazon, are resulting in a very imbalanced market. Discretionary stocks tend to do well in environments like today, with solid growth, rising consumer confidence, and low unemployment. Consumers have money and the confidence to consume. Throughout much of the pandemic recovery, the sector was among the leaders. While Amazon is up 25% this year and the S&P 500 10% higher, the sector, sans Amazon, is down 6%. For instance, Nike, Starbucks, and McDonald’s are down 16%, 7%, and 10%, respectively. Our analysis tells us that discretionary stocks are grossly underperforming. Additionally, it would be much worse if not for Amazon’s strength.
The analysis suggests that investors may be bracing for high unemployment rates and a loss of confidence in the next six to nine months.
What To Watch
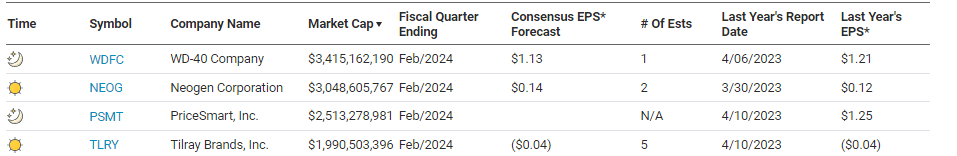
Earnings
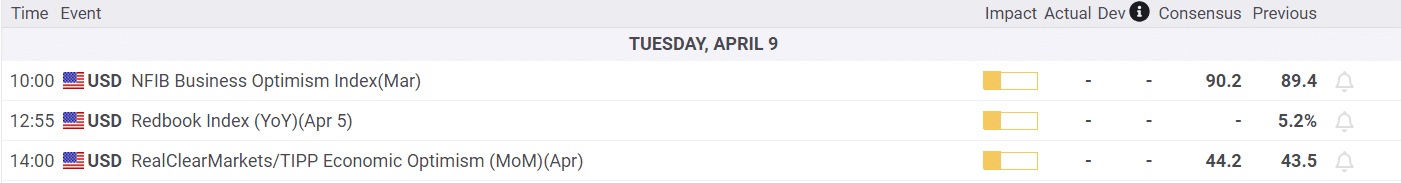
Economy
Market Trading Update
As noted yesterday, the market did break below the all-important 20-DMA on Thursday. However, yesterday, it managed to reclaim that level by closing above it. This is important as it does NOT confirm the break of support. As of now, the running bullish trend remains intact.
However, that is just for today. We are specifically looking at where the market closes for the week. The break of support on Thursday is important, and regardless of what happens intra-week, if the market closes below Thursday’s close, the break of support will be confirmed. We give the market time to reduce the “whipsaw effect” of daily market moves. But as of yesterday’s close the 20-DMA support level remains intact, and it appears that last Thursday’s sell-off was countered by algorithms “buying the dip.”
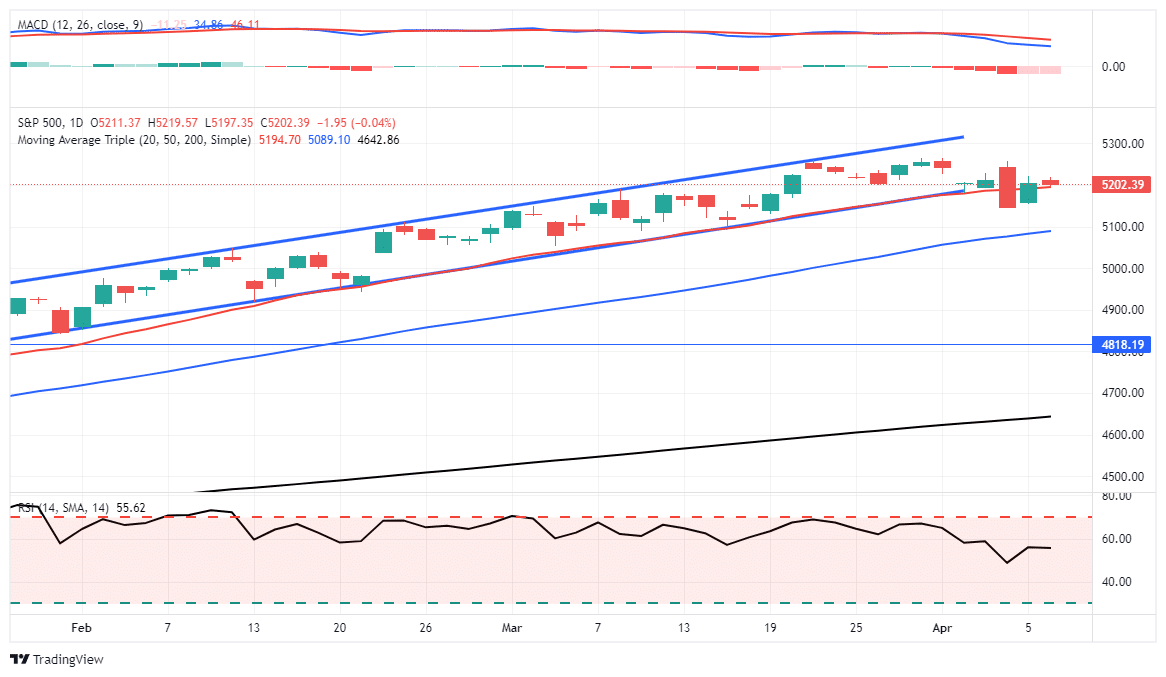
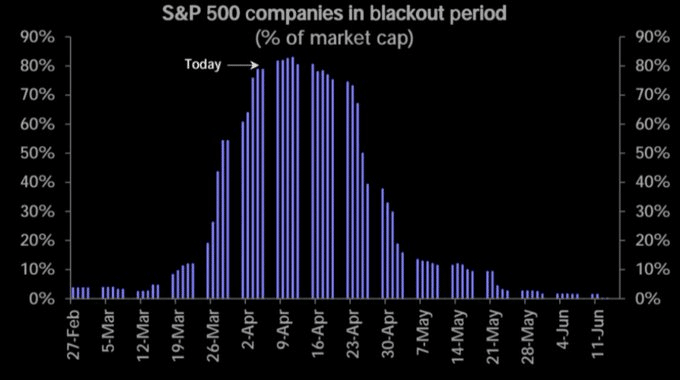
There is still a good bit of buying momentum in the market as bullish investors remain committed, but that momentum is waning. Such leaves the market susceptible to a trend change, and a good bit of economic data this week could spook investors. Furthermore, as shown, we are now at a peak “blackout” period for share buybacks, which has been a critical support for the market since November.
Bonds Under Pressure
The bond market is on edge due to the recent spate of stronger-than-expected economic data and continued sticky inflation figures. This week may prove pivotal for bonds. CPI on Wednesday and PPI on Thursday will help us better appreciate if the recent uptick in inflation is seasonal or may last a while. Further weighing on the bond market are the 10 and 30-year Treasury auctions on Wednesday and Thursday, respectively.
Often, the banks that bid on the auctions will try to establish a short position going into the auction. The logic is they can sell at higher prices and cover their positions in the auctions at lower prices. The combination of the auctions and inflation worries may entice Wall Street to take larger short bets heading into the auctions. If, however, CPI and PPI are as expected or lower, there could be a strong bid as the banks may not want to go into the auctions as short as they previously anticipated.
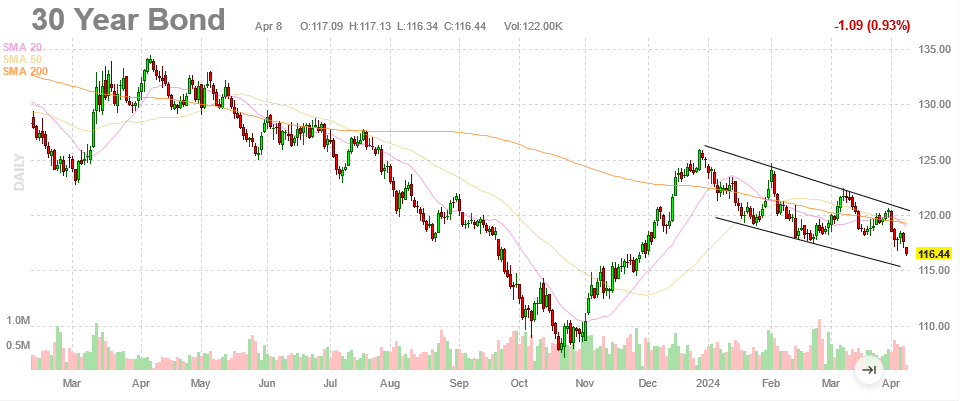
The graph below shows the channel in which the long bond future has traded since the start of the year. The channel shows the upside versus downside potential is about 2:1. However, a break below 115 could trigger further selling.
Buybacks Come To Temporary Halt
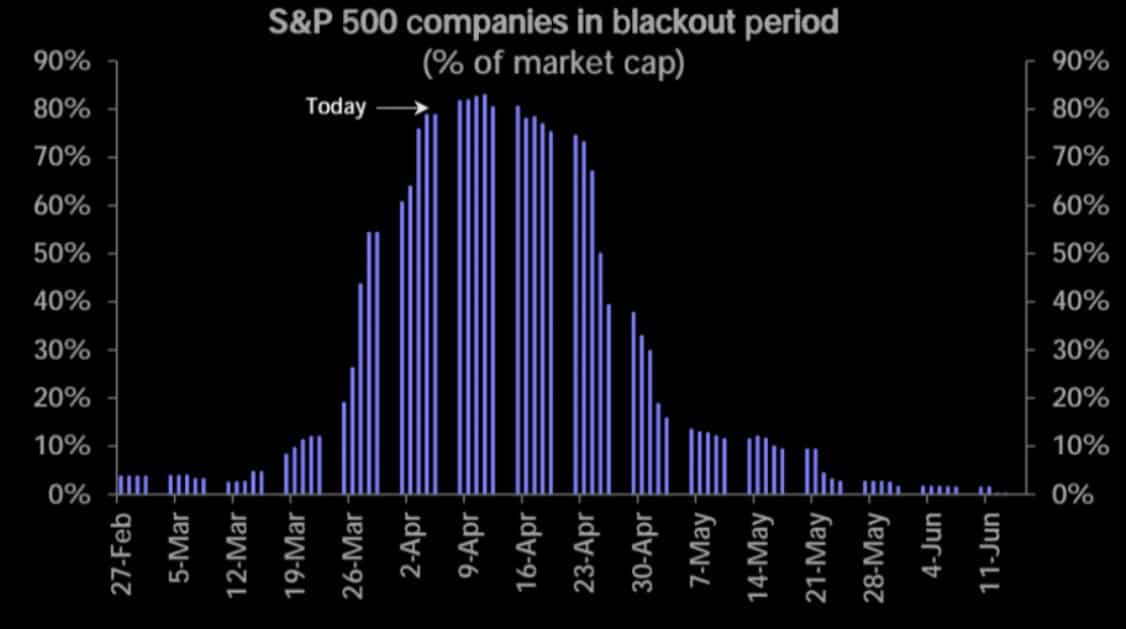
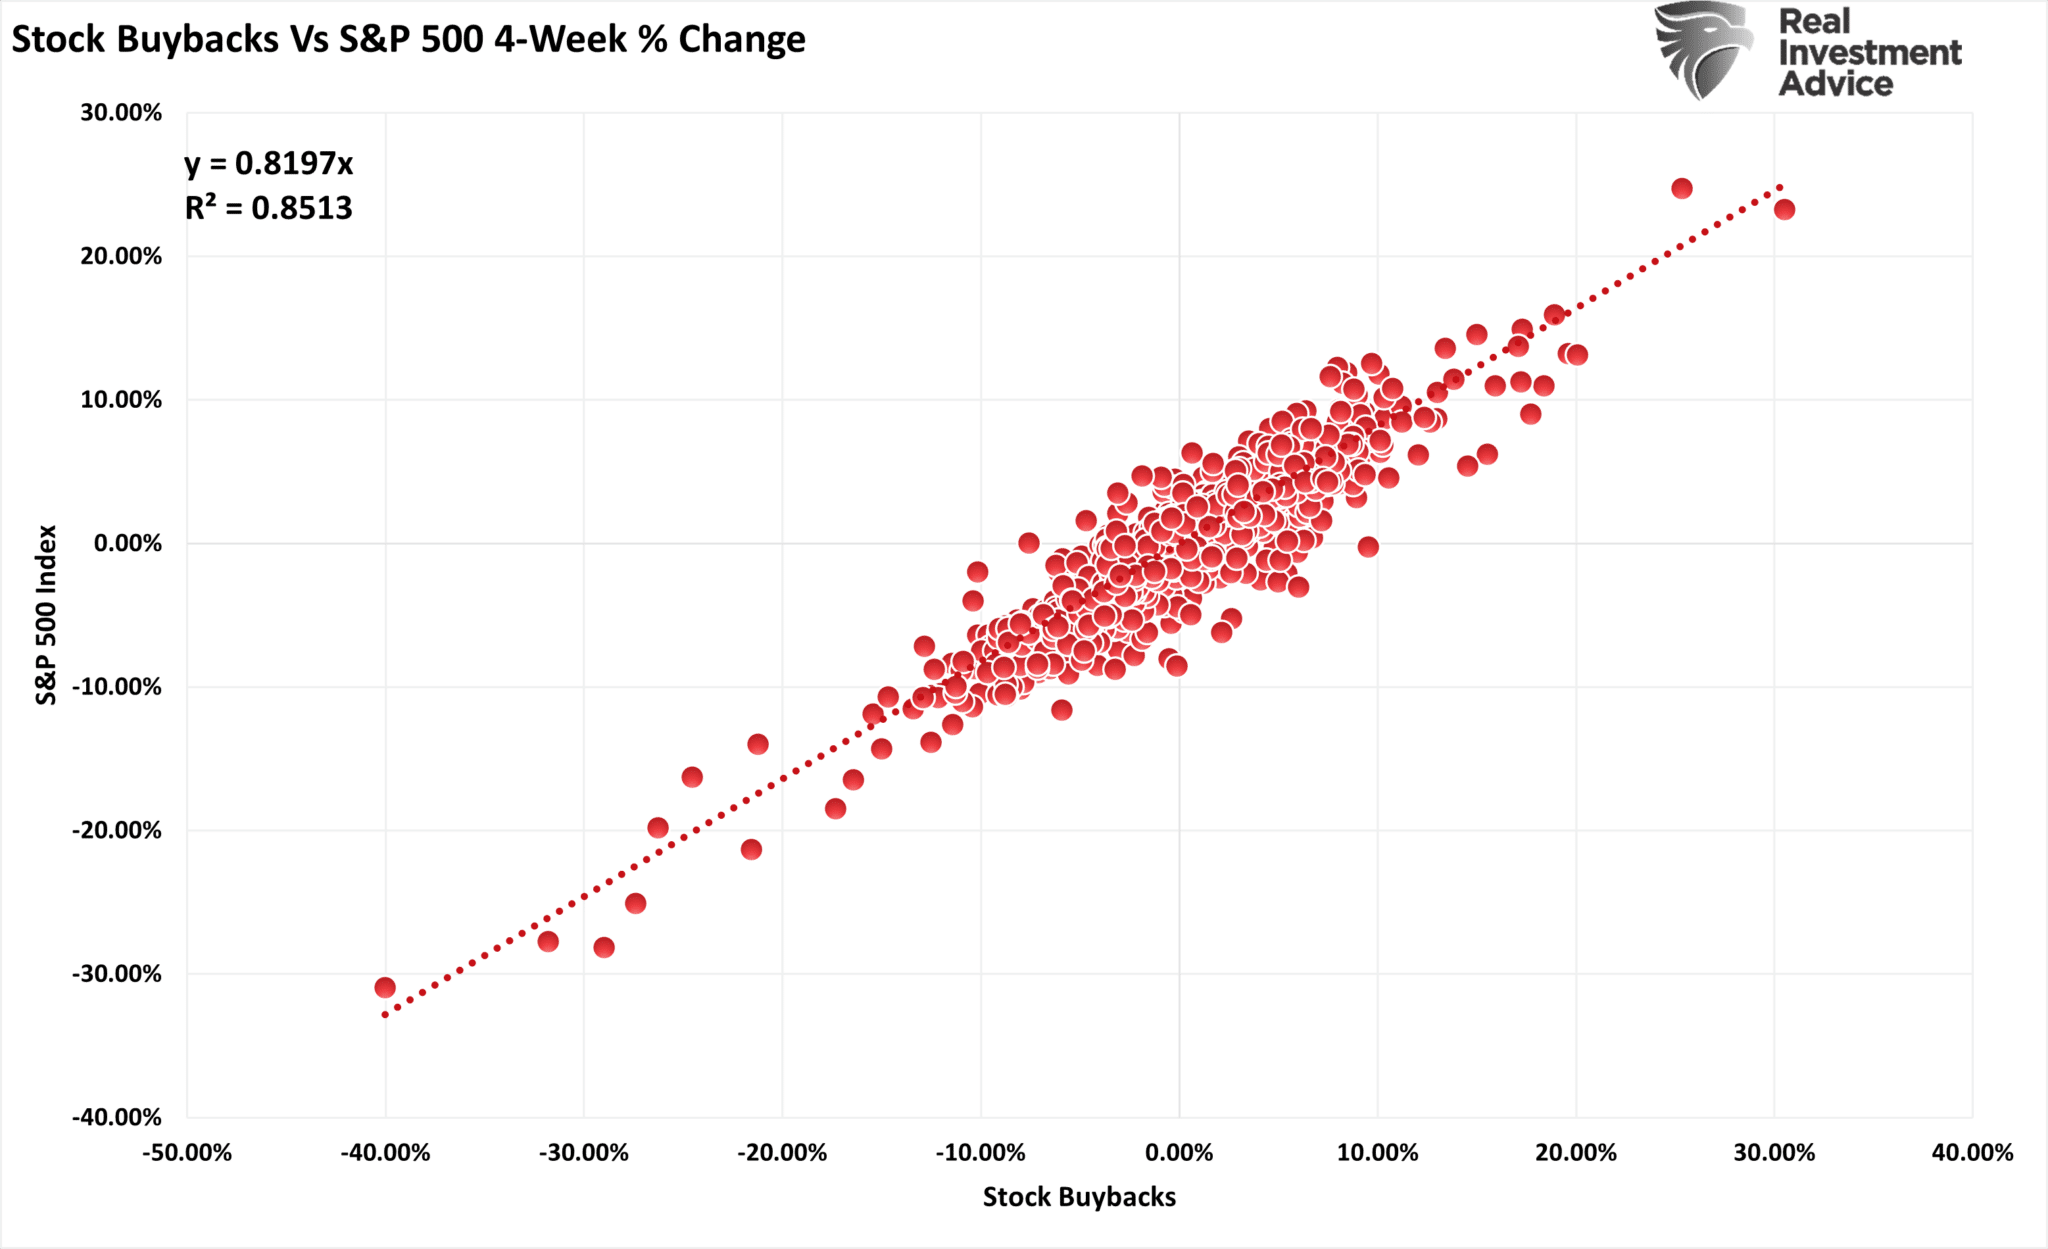
With earnings season kicking off in earnest this week, many companies will be restricted from buying back shares in their companies. As the Market Ear graph below shows, 75% of S&P 500 companies will be in a blackout period through April 23. Buybacks are a predominant driver of market returns and help account for some of the over/underperformance of many stocks. The second graph shows a very high correlation (R-squared =.85) between the four-week change in buybacks and the change in the S&P 500.
The blackout period is only three weeks long, so any effect on the market will be short-lived. However, if the market declines, some support for propping up stock prices may be missing. Accordingly, the lack of buybacks may result in a little more volatility than we have grown accustomed to over the last six months.
Tweet of the Day

“Want to have better long-term success in managing your portfolio? Here are our 15-trading rules for managing market risks.”
Related: The Jobs Market Remains Hot