Written by: David Waddell | Waddell and Associates
THE BOTTOM LINE:
Halloween is back! With such a great start to the year, investor candy buckets are full, and the volatility setup across US equity markets provides clarity on the recent price action. So enjoy that extra piece of Halloween chocolate! Halfway through Q3 earnings season, the volatility implied through institutional hedging has failed to materialize, providing investors with buying opportunities across various asset classes. All treats, no tricks!
Halloween is coming up on Thursday, and that means it’s time to take the kids out to go trick or treating. As a dad of three young children, Halloween is such a fun and unique time together, but getting the kids to sleep after countless chocolate bars is usually the spooky part of the night! As for investors, Halloween night need not be so scary. I touched on the volatility setup a few weeks ago, but let’s run the tapes and review how investors can benefit from other market participants acting fearful.
Earning our candy!
As David mentioned in last week’s blog, it is Q3 earnings season, and further equity market upside will need to be supported by accelerating earnings growth. So far, third-quarter earnings growth for the S&P500 sits at 3.4%, taking year-over-year earnings growth to 12.4%. Of the S&P500 constituents, the magnificent seven are expected to lead the pack this quarter and in the foreseeable future, even accelerating their earnings growth into the second half of 2025. The positive earnings momentum is constructive for further equity market price appreciation, but companies will still need to deliver.

Price movement, past and present
One of the most interesting yet boring things I like to read and talk about is market structure. How markets operate is both a function of the rules of the game and the players playing. Knowing and understanding the dynamics of all players and their decisions can help investors navigate and understand short-term price movements.
Let’s break down the volatility setup as it relates to the Q3 earnings season. Equity volatility can be quoted in realized and implied terms—these are fancy Wall Street terms for what volatility has been in the past, i.e. realized, and what the market is expecting volatility to be in the future, i.e. implied. This is a vital part of market structure. Big traders like hedge funds and institutions utilize short-term options contracts to hedge their positions against future moves in price. So, in advance of events where there is a higher probability of a larger range of price movement, institutions buy protection in the form of put options against positions in their portfolios. Did I mention it’s earnings season?
Single stock price moves post earnings announcements can vary wildly. However, as of Friday, of the S&P 500 companies that have released Q3 earnings, their respective share prices have moved in +-3% range post-announcement, and importantly, it’s the options market that prices the expected volatility of the underlying share prices in advance of the release. But who cares, and what can we do about implied volatility?
“Be greedy when others are fearful.” – Warren Buffett
Capitalize on the fear! An important part of market dynamics is understanding when market participants are inefficiently expecting more volatility than what is likely to materialize from a statistical probability perspective.
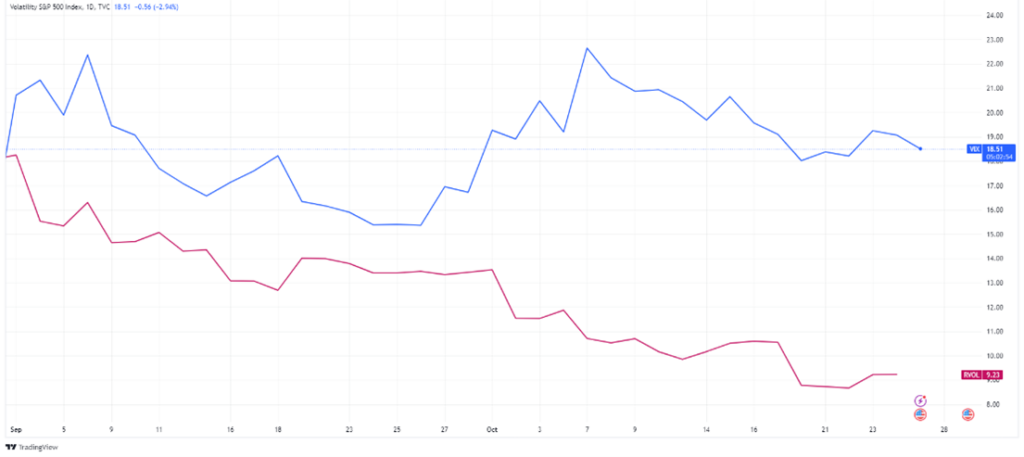
Let’s look at this past week. Throughout most of the week, the 30-day implied volatility of the S&P500 index sat around 18.7, while the 30-day realized volatility sat around 9.2. This represents a 100%+ premium of expected to actual volatility. Over the last three years, that amount of premium is over two standard deviations from the mean, which, in a typical bell curve, we know only occurs about 5% of the time. An outlier!

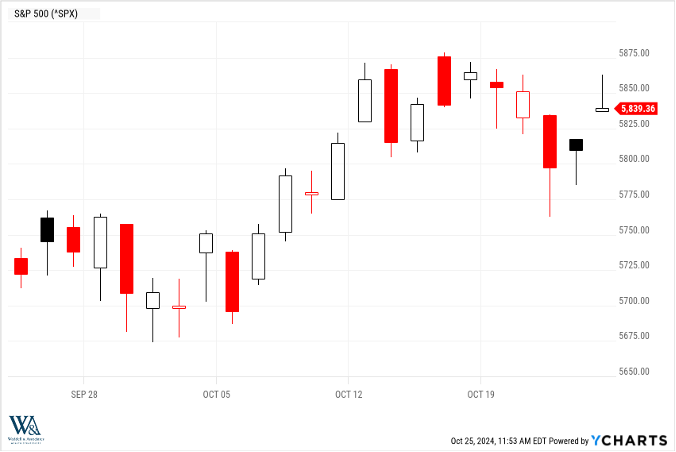
All told, by understanding short-term volatility structure and the premiums paid by institutions to hedge their portfolios from Q3 earnings announcements, investors can capitalize in the short-term by deploying capital on irrational downward movements in price, like the middle of last week:

Sources: Factset, YCharts, Hedgeye Risk Management, TradingView, Cboe Exchange


