
Trending

Written by: Adam Schrier and Art Torrey | New York Life Investments
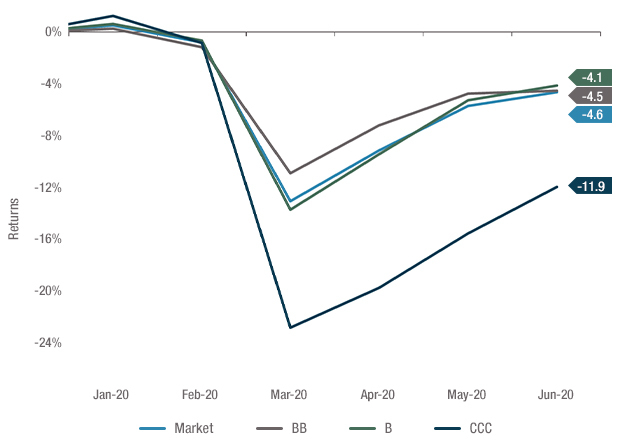
This has been quite a year for the floating rate loan asset class – mutual funds and ETFs have taken in over $28bn, fully recouping the $27bn of outflows from 2020. At the mid-point of 2020, loans were down 4.1%, led by CCCs’ 11.9% decline. In stark contrast to last year, due to both improving credit conditions and almost no duration, loans appreciated 3.3% during the first half of this year. Notably, CCC-rated loans have returned 10%, outperforming BBs by 8.4%. Given this massive outperformance, we believe it is important for investors to take a deeper look into lower quality loans, and re-evaluate their risk taking for the second half of the year.
Figure 1: Vastly different first halves: 2020 vs 2021 performance by quality
Floating rate loan performance 1H 2020
Floating rate loan performance 1H 2021
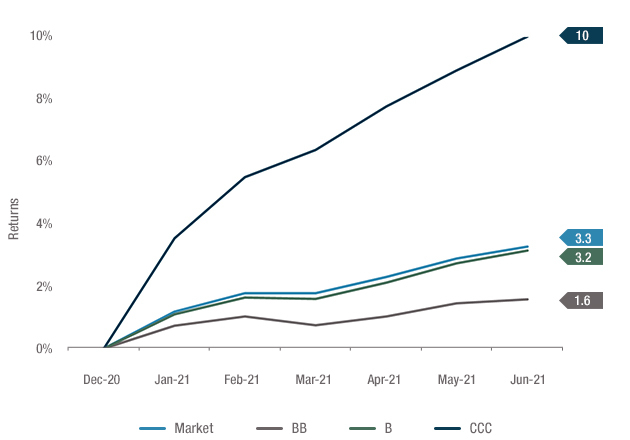
Source: LCD, 1/1/2020 – 6/30/2021. Loans represented by the S&P/LSTA Leveraged Loan Index. It is not possible to invest directly in an index. Past Performance does not guarantee future results.
A key consideration is volatility – as demonstrated by the comparison between the first half of 2020 versus the first half of 2021, lower quality loans have significantly greater volatility than higher quality loans. While CCCs look great in recent quarters, the same can’t be said for Q1 2020 when CCCs were down 21.2%, underperforming the market by 800 bps.
Looking further back, we calculated the upside capture and downside capture ratios of the market segmented by quality over the past 10 years. What immediately jumps out, is the considerable upside and downside capture of CCCs. Also noteworthy, is that CCCs have greater downside than upside – meaning they participate in downward trending markets to a greater extent than they do positive markets.
Figure 2: Over the last 10 years, CCCs have double the down capture of the market
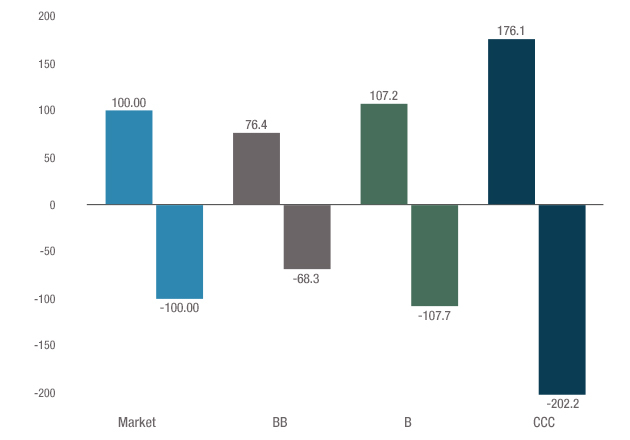
Source: Credit Suisse, 6/30/2011 – 6/30/2021. Loans represented by the Credit Suisse Leveraged Loan Index. It is not possible to invest directly in an index. Past Performance does not guarantee future results.
During the pandemic, CCCs reached a 10-year low dollar price of 64, and by year-end, had already recovered to 87. By the end of April 2021, they further appreciated to 92, and have remained in the 92s since. This is the highest level in six years and nine points above the 10-year average.
More aggressive loan funds benefited from this rapid snapback, particularly during the first quarter. Over the last couple of months, CCC prices have leveled off and only provided modest price appreciation. Given the current price level, CCCs are “priced to perfection” in our view. In fact, there are many COVID sensitive names that are now trading close to par – which leaves plenty of room for downside, with little upside. Investors were well compensated for risk taking from late 2020 through early 2021, but it is critical to evaluate return prospects going forward, and not chase yesterday’s returns.
Figure 3: CCC loan prices are well above average
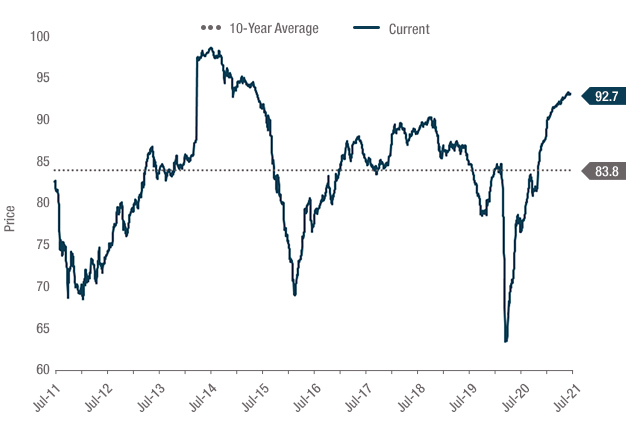
Source: LCD, 6/30/2011 – 6/30/2021. Loans represented by the S&P/LSTA Leveraged Loan Index. It is not possible to invest directly in an index. Past Performance does not guarantee future results.
One way to do this is to look at how CCCs have performed given various starting points. We analyzed rolling 1-year returns over the past 20 years, segmented by starting price. This answers the question, “historically, what is the average 1-year return of both CCCs and the market, given various price levels?”.
As expected, CCCs outperformed the market at lower dollar prices. However, as CCCs approached 90, they began to underperform the market. At prices greater than 92, the average 1-year forward return of CCCs not only underperforms the market, but is also negative.
Figure 4: At higher dollar prices, CCCs average negative 1-year returns
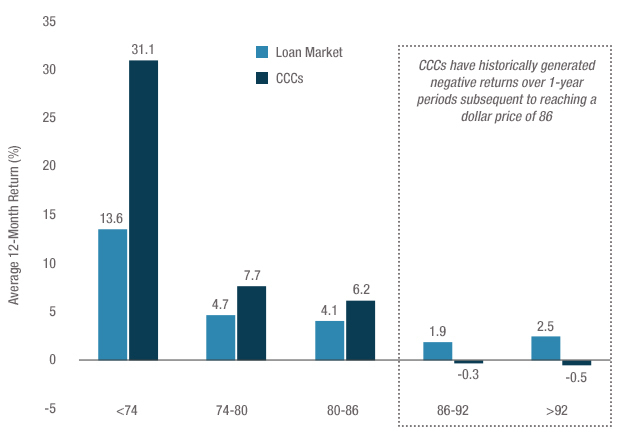
Source: Credit Suisse, 6/30/2001 – 6/30/2021. Loans represented by the Credit Suisse Leveraged Loan Index. Average 12-month forward returns over 20 years segmented by CCC price. It is not possible to invest directly in an index. Past Performance does not guarantee future results.
At New York Life Investments, we believe that aggressively positioned portfolios have underperformed more in times of credit stress, than they outperformed during times of credit prosperity. Therefore, we construct portfolios with a quality bias because they result in a less volatile, more attractive return profile.
We approach floating rate loans as an income generation strategy rather than total return. When loans default, they don’t pay interest which adversely impacts a portfolio’s yield. Following restructurings, a portfolio will often receive equity which does not contribute to income and can take years to recover to pre-bankruptcy value. Since CCCs are much more likely to default than BB-rated loans or even single-B loans, we tend to avoid that part of the market.
Even when CCC prices are depressed, we remain disciplined in our process that consists of in-depth credit analysis, allowing us to underwrite loans in which we have high conviction in the issuer’s long-term prospects.
When there is a bullish market sentiment where higher beta risk assets outperform, we may not perform as strong on a relative basis. Particularly in low yield environments, some managers may reach for yield – not only through CCCs, but also second lien and middle market loans which are rather illiquid, and high yield bonds which add duration.
Because of that willingness to reach for yield, the average price of CCCs is now at a multi-year high, and the spread between single-Bs and CCCs is the lowest in seven years – almost 300 bps below the 10-year median. This is an important metric because it provides a measure of incremental compensation for taking incremental risk.
Therefore, investors need to be mindful of economic conditions as well as relative value when assessing the risk taking of their managers.
Figure 5: Compensation for taking CCC-risk has dramatically declined over the last year
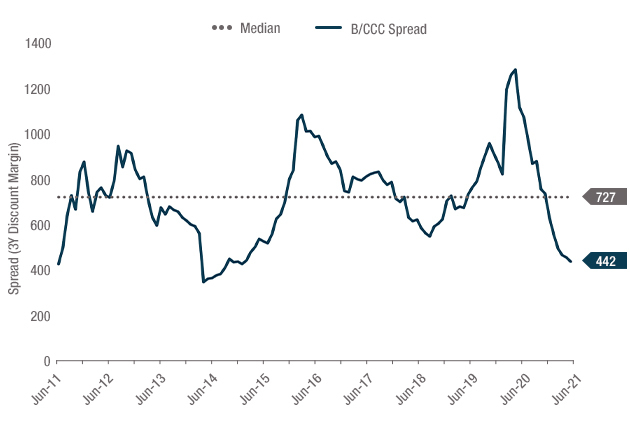
Source: Credit Suisse, 6/30/2011 – 6/30/2021. Loans represented by the Credit Suisse Leveraged Loan Index. Spreads are the difference between 3 Year Discount Margins of single B-rated loans and CCC-rated loans. It is not possible to invest directly in an index. Past Performance does not guarantee future results.
When there is complacency in risk taking, particularly among risk averse investors, the compensation for that risk tends to erode. Given improving corporate fundamentals, low default rates, and the re-opening of the economy, non-investment grade fixed income may be appropriate for many investor’s portfolios. In rapidly changing markets, it is important to periodically re-evaluate risk taking to ensure appropriate compensation for that risk. With relatively high prices and lower incremental spread opportunities in the riskiest part of the loan market, a more conservative approach to credit risk may be warranted.
Related: The Risks of Reflation