
Trending

Human capital is an important input for growth at non-manufacturing tech companies such as NVDA. It fills a role as vital as CAPEX to a manufacturing company. Employee knowledge accumulates over time, carries positive externalities, and is often the lifeblood of innovation at these firms. However, current accounting principles were developed prior to the rise of the digital economy. They allow for the capitalization and depreciation of CAPEX but require companies to immediately expense internal R&D. Of course, R&D expense is where these firms report compensation paid to the growth engine of their business.
Although R&D projects obtained via acquisition are capitalized and amortized, in-house R&D projects still must be expensed as incurred. This treatment ignores the similar utility of both “types” of R&D. The financial industry adopted EBITDA to adjust for differences in operating & capital structure for CAPEX-heavy companies. Yet, there’s still no standard convention to level the playing field for R&D-heavy companies. Thus, there is a case for adjusting EBITDA for R&D expense. It slightly reduces earnings volatility and makes for a better comparison to stocks with differing operating structures.
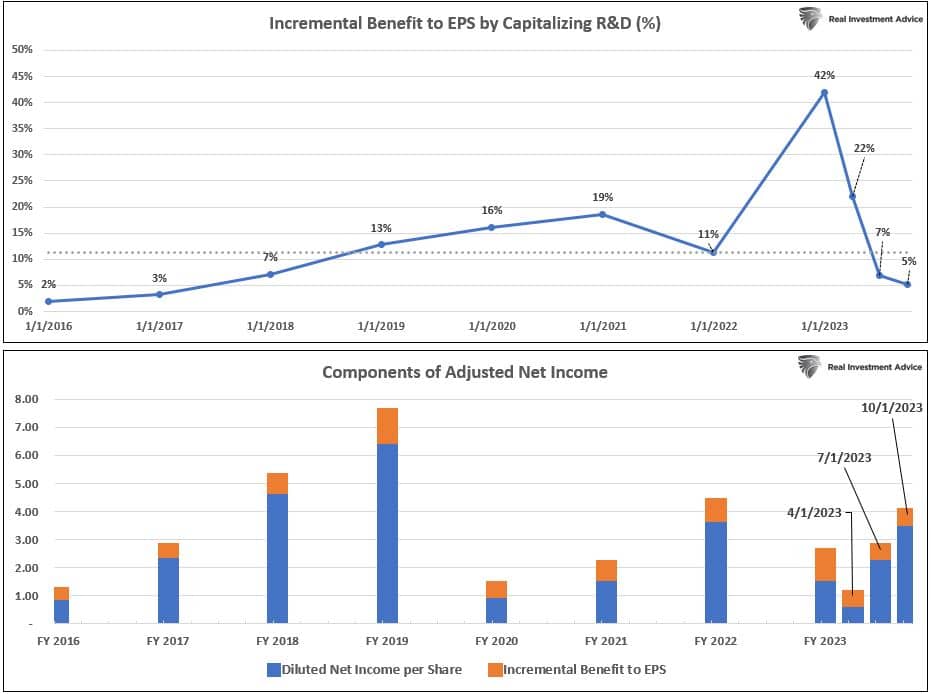
By adjusting NVDA’s financial statements to capitalize and amortize R&D expense (ex-stock-based compensation) over four years, we find that TTM EBITDA would be 10-12% higher than reported. We use P/E as a simple way to illustrate our adjustment’s impact on valuation. As shown below, the median incremental benefit to EPS since 2016 is 11% while the average is slightly higher at 11.33%. Using adjusted trailing EPS, TTM P/E falls 10% from 65.15 to 58.7. By adjusting the forward EPS estimate, the forward P/E drops 10% from 23.7 to 21.4. We elaborate on our case for adjusting earnings of R&D dependent companies below.
What To Watch Today
Economy

Market Trading Update
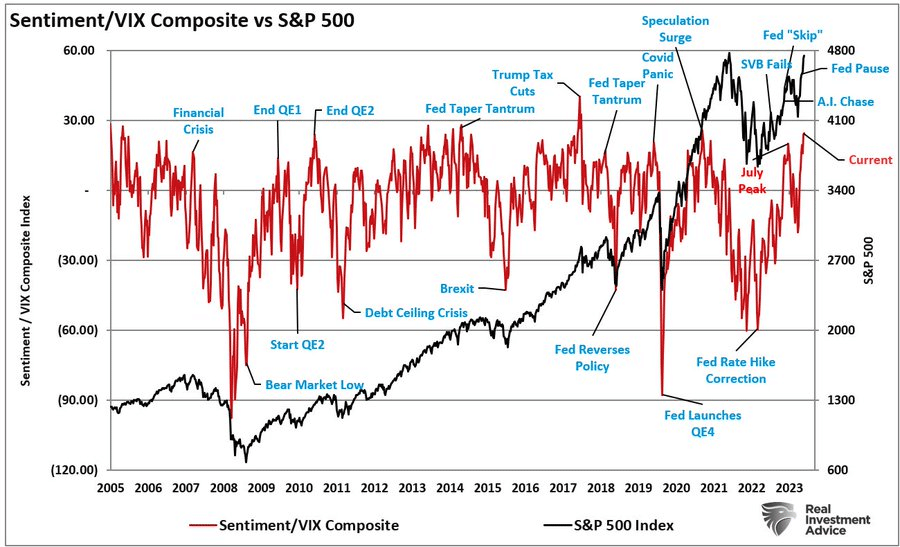
On January 3, 2022 the S&P 500 index closed at a record high of 4796.56. Nearly two years later the market is closing in on that milestone with the market closing yesterday just 15 points away. With just two trading days left in the year, a new all-time closing high seems inevitable. The question then become what happens next?
As noted yesterday on Twitter/X, our composite index of retail and institutional sentiment as compared to the volatility index, is at a reading higher than we saw in July when the market peaked. The subsequent correction clipped 10% off the markets. Will this time be different? While high sentiment readings do not necessarily mean the market will correct by 10%, it does suggest that at least a short-term correction to reduce the overbought condition is likely.
With momentum and sentiment firmly intact, there seems little to keep the market from rising for now. However, we will likely see some of the froth come off in January.
Putting NVDA’s R&D Dependence in Perspective
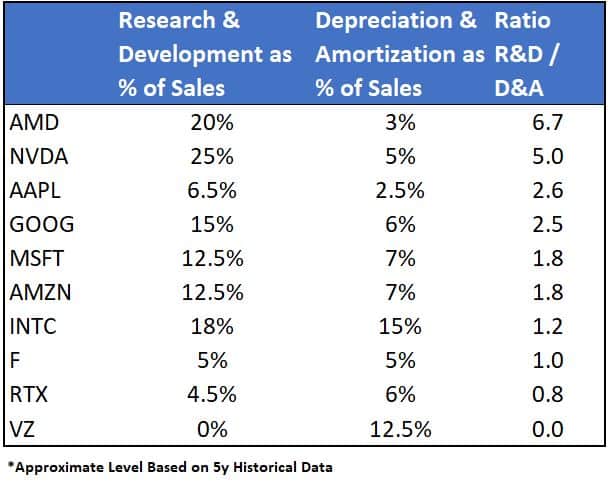
To demonstrate the value of the earnings adjustment previously discussed, we compare R&D dependence for a handful of S&P 500 companies below. You’ll notice that AMD and NVDA are in a class of their own, while the following four stocks have a greater bias toward R&D expense than the last four. If you compare company valuations based on EBITDA, therein lies the value of adjusting EBITDA to level the playing field, as discussed above.
It’s important to remember that if you adjust the earnings of one company, you must make that adjustment for every company to which you are comparing its fundamentals. There’s no set period length to amortize R&D, but it must remain consistent across companies. Also, note that we capitalized and amortized only the non-stock-based compensation portion of NVDA’s R&D expense. The difference would be even more significant if we had used the full R&D expense instead.
Credit Spreads Hover Near 18-Month Lows
The 10-year Treasury yield has fallen over 100 basis points since October 31st. Credit spreads have fallen alongside yields as investors cozy up to decreasing default risk. The catch is that credit spreads have been contracting most of the year while benchmark yields were rising. As shown below, both the investment grade and high-yield bond index credit spreads are hovering near 18-month lows. However, both the 5- and 10-year yields are still 100+ basis points above their respective levels the last time credit spreads were this low.
With credit spreads near historic lows and yields still somewhat elevated, there’s a case for adjusting bond exposure to favor treasuries rather than corporate bonds. There’s little to suggest that credit spreads should tighten further than they have over the past ten years, but there’s an argument to make that they are too tight for the current credit environment. Thus, avoiding exposure to changing credit spreads may pay off until some sort of normalization takes place.


Tweet of the Day
“Want to have better long-term success in managing your portfolio? Here are our 15-trading rules for managing market risks.”
Related: Who Wins the Electric Vehicle Race?