
Trending

Written by: Bryce Coward | Knowledge Leaders Capital
With the S&P 500 up nearly 20% and international developed stocks up 13% year-to-date, the markets are having a banner year so far. But, we are squarely in the weakest seasonal months of the year (September and October) and we are starting to see the first signs of divergences between stocks and variables that are related to stock market performance. Not only that, but we have a Federal Reserve that will likely soon lay plans for asset purchase tapering; and a Washington DC that is grappling the debt ceiling, potential government shut downs, potential default, and an infrastructure bill that may include significant tax increases. Needless to say, between market divergences, seasonality, and policy dynamics, there’s a growing potential for the stock market to see some increased volatility in the near future.
So, here are the things we are looking at and will continue to monitor this fall to help ascertain whether 3% dips should be bought or whether a deeper correction is in the offing.
Number 1:
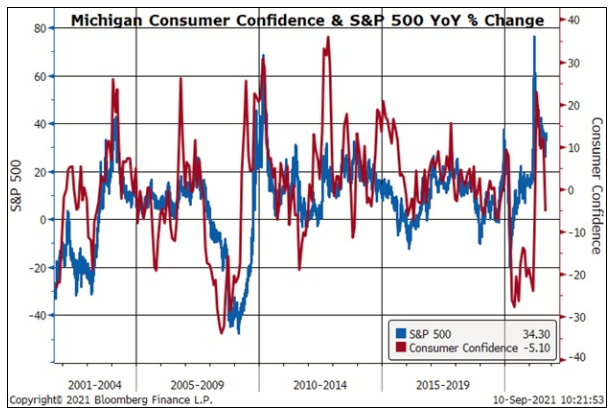
Consumer confidence. Consumer confidence, whether measured by the Conference Board or the University of Michigan is starting to “come off” in a pretty big way. This isn’t the post to opine about the reasons for the decline (inflation, unemployment, housing shortages, gas prices, etc.), but we do note that consumer confidence is highly correlated to stock market performance. This makes sense since fully 57% of US households own stocks. So, it’s interesting that consumer confidence (red line) appears to be collapsing but stocks have held their own (blue line).
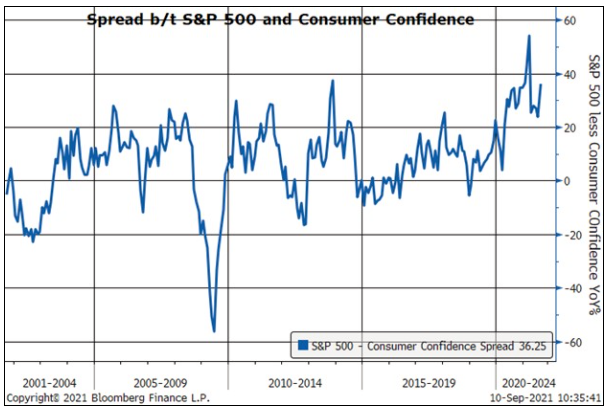
In this next chart we show the spread between the YoY % change in the S&P 500 and that of consumer confidence, and we observe that this spread has only been higher on a few brief occasions. This begs the question, will stocks fall or consumer confidence rise?
Number 2:
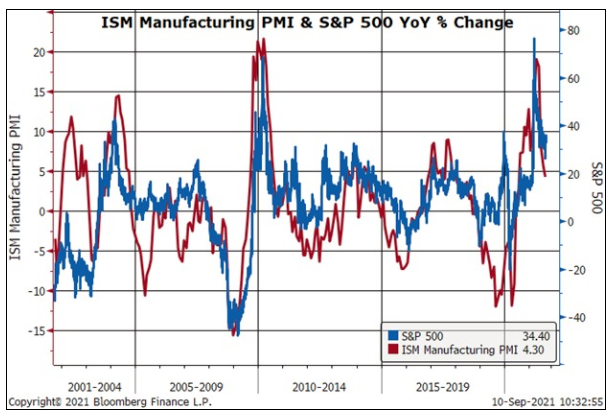
In a similar vein, stocks are outpacing real time gauges of economic activity by a wide margin. Here we plot the change in the ISM manufacturing index (red) against the S&P 500 (blue). Activity is slowing while stocks remain firm, which is odd since earnings are a function of economic activity.
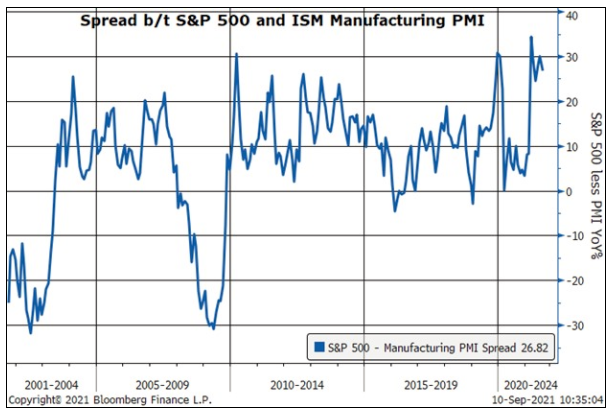
In this next chart we can see more clearly by how much stocks are “outperforming” economic growth. Again, we plot the spread between the yearly change in the S&P 500 and the ISM manufacturing index. It’s in nosebleed territory, implying either growth picks up steam or stocks settle down.
Number 3:
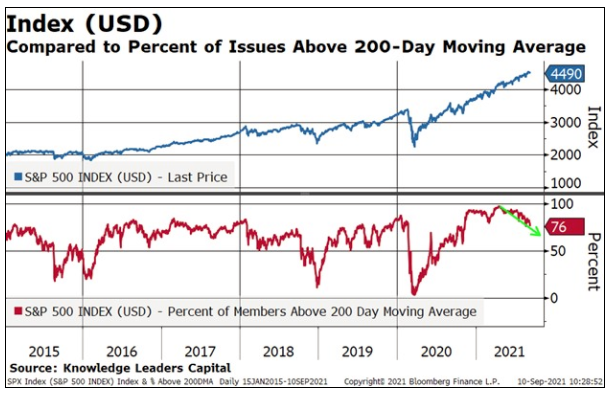
We are beginning to see a deterioration in internal breadth within the stock market. The S&P 500 is close to its all-time highs and trading almost 10% above its 200 day moving average. But, the percent of stocks trading above their own 200 day moving average peaked out in Q1 and is rolling over. In other words, the market is being led by fewer and fewer stocks on each subsequent advance, a setup that can be a precursor for correction, if it gets worse.
Number 4:
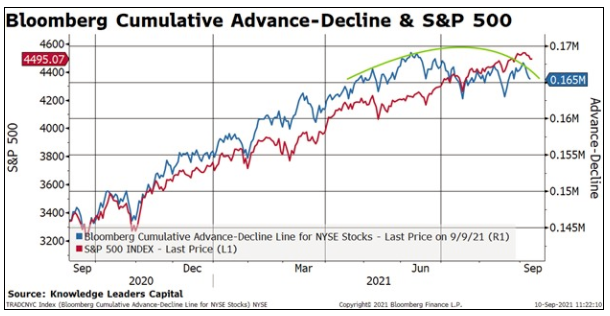
Sticking with indicators of market breadth, we note that the Bloomberg advance-decline line for NYSE stocks peaked last June and has been developing a topping pattern ever since. This, too, shows waning participation in the market’s advance, which is often precedes corrections deeper than the 3% average correction we’ve seen so far this year.
Number 5:
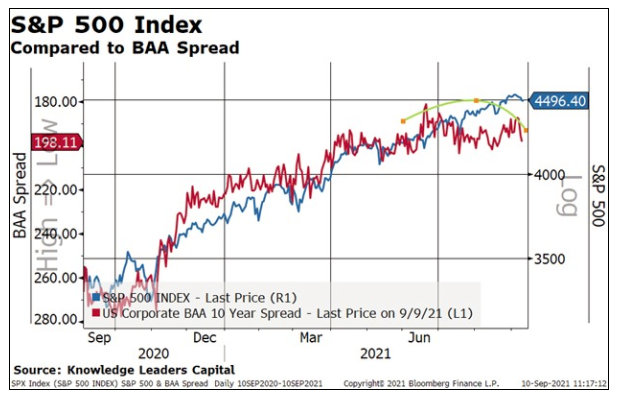
Finally, while early, credit conditions are no longer improving. Typically, advances in stocks are accompanied by tightening credit spreads in the corporate bond market, since rising stock prices are at least in part a function of improving fundamentals. Yet, corporate credit spreads stopped narrowing in June even as the S&P 500 tacked on another 7%. If spreads take out recent wides, we would view it as a sign that bond investors are starting to get jittery about corporate fundamentals, which is rarely good news for stock prices.
To be clear, none of these divergences individually are screaming for defensive action. But, taken together, they form a mosaic that suggests the antennae should be a little more piqued than normal. This is especially true given that we’re still in hurricane season, both from a market and policy perspective…and of course from a weather perspective too.
Related: EVs Could Mean Full Cycle Outperformance of Copper Producers