What is a hurdle rate for a business? There are multiple definitions that you will see offered, from it being the cost of raising capital for that business to an opportunity cost, i.e., a return that you can make investing elsewhere, to a required return for investors in that business. In a sense, each of those definitions has an element of truth to it, but used loosely, each of them can also lead you to the wrong destination. In this post, I will start by looking at the role that hurdle rates play in running a business, with the consequences of setting them too high or too low, and then look at the fundamentals that should cause hurdle rates to vary across companies.
What is a hurdle rate?
Every business, small or large, public or private, faces a challenge of how to allocate capital across competing needs (projects, investments and acquisitions), though some businesses have more opportunities or face more severe constraints than others. In making these allocation or investment decisions, businesses have to make judgments on the minimum return that they would accept on an investment, given its risk, and that minimum return is referenced as the hurdle rate. Having said that, though, it is worth noting that this is where the consensus ends, since there are deep divides on how this hurdle rate should be computed, with companies diverging and following three broad paths to get that number:
1. Cost of raising funds (capital): Since the funds that are invested by a business come from equity investors and lenders, one way in which the hurdle rate is computed is by looking at how much it costs the investing company to raise those funds. Without any loss of generality, if we define the rate of return that investors demand for investing in equity as the cost of equity and the rate that lenders charge for lending you money as the cost of debt, the weighted average of these two costs, with the weights representing how much of each source you use, is the cost of capital:
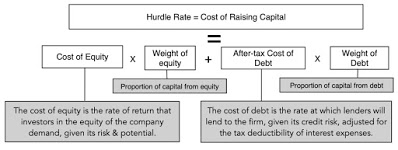
The problem with a corporate cost of capital as a hurdle rate is that it presumes that every project the company takes has the same overall risk profile as the company. That may make sense if you are a retailer, and every investment you make is another mall store, but it clearly does not, if you are a company in multiple businesses (or geographies) and some investments are much riskier than others.
2. Opportunity Cost: The use of a corporate cost of capital as a hurdle rate exposes you to risk shifting, where safe projects subsidize risky projects, and one simple and effective fix is to shift the focus away from how much it costs a company to raise money to the risk of the project or investment under consideration. The notion of opportunity cost makes sense only if it is conditioned on risk, and the opportunity cost of investing in a project should be the rate of return you could earn on an alternative investment of equivalent risk.
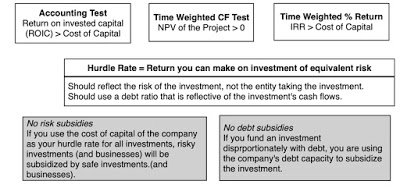
If you follow this practice, you are replacing a corporate cost of capital with a project-specific hurdle rate, that reflects the risk of that project. It is more work than having one corporate hurdle rate, but you are replacing a bludgeon with a scalpel, and the more varied your projects, in terms of business and geography, the greater the payoff.
3. Capital Constrained Clearing Rate: The notion that any investment that earns more than what other investments of equivalent risk are delivering is a good one, but it is built on the presumption that businesses have the capital to take all good investments. Many companies face capital constraints, some external (lack of access to capital markets) and some internal (a refusal to issue new equity because of dilution concerns), and consequently cannot follow this rule. Instead, they find a hurdle rate that incorporates their capital constraints, yielding a hurdle rate much higher than the true opportunity cost. To illustrate, assume that you are a company with fifty projects, all of similar risk, and all earning more than the 10% that investments of equivalent risk are making in the market. If you faced no capital constraints, you would take all fifty, but assume that you have limited capital, and that you rank these projects from highest to lowest returns (IRR or accounting return). The logical thing to do is to work down the list, accepting projects with the highest returns first until you run out of capital. If the last project that you end up accepting has a 20% rate of return, you set your hurdle rate as 20%, a number that clears your capital.
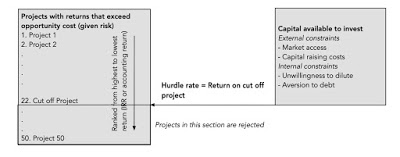
By itself, this practice make sense, but inertia is one of the strongest forces in business, and that 20% hurdle rate often become embedded in practice, even as the company grows and capital constraints disappear. The consequences are both predictable and damaging, since projects making less than 20% are being turned away, even as cash builds up in these companies.
While the three approaches look divergent and you may expect them to yield different answers, they are tied together more than you realize, at least in steady state. Specifically, if market prices reflect fair value, the cost of raising funds for a company will reflect the weighted average of the opportunity costs of the investments they make as a company, and a combination of scaling up (reducing capital constraints) and increased competition (reducing returns on investments) will push the capital constrained clearing rate towards the other two measures. If you are willing to be bored, I do have a paper on cost of capital that explains how the different definitions play out, as well as the details of estimating each one.
Hurdle Rate - The Drivers
For the rest of this post, I will adopt the opportunity cost version of hurdle rates, where you are trying to measure how much you should demand on a project or investment, given its risks. In this section, I will point to the three key determinants of whether the hurdle rate on your next project should be 5% or 15%. The first is the business that the investment is in, and the risk profile of that business. The second is geography, with hurdle rates being higher for projects in some parts of the world, than others. The third is currency, with hurdle rates, for any given project, varying across currencies.
A. Business
If you are a company with two business lines, one with predictable revenues and stable profit margins, and the other with cyclical revenues and volatile margins, you would expect to, other things remaining equal, use a lower hurdle rate for the first than the second. That said, there are two tricky components of business risk that you need to navigate:
- Firm specific versus Macro risk: When you invest in a company, be it GameStop or Apple, there are two types of risks that you are exposed to, risks that are specific to the company (that GameStop's online sales will be undercut by competition or that Apple's next iPhone launch may not go well) and risks that are macroeconomic and market-wide (that the economy may not come back strongly from the shut down or that inflation will flare up). If you put all your money in one or the other of these companies, you are exposed to all these risks, but if you spread your bets across a dozen or more companies, you will find that company-specific risk gets averaged out. From a hurdle rate perspective, this implies that companies, where the marginal investors (who own a lot of stock and trade that stock) are diversified, should incorporate only macroeconomic or market risk into hurdle rates. For small private firms, where the sole owner is not diversified, the hurdle rate will have to incorporate and be higher.
- Financial leverage: There are two ways you can raise funding for a company, and since lenders have contractual claims on the cash flows, the cost of debt should be lower than the cost of equity for almost every company, and that difference is increased by the tax laws tilt towards debt (with interest expenses being tax deductible). Unfortunately, there are many who take this reality and jump to the conclusion that adding debt will lower your hurdle rate, an argument that is built on false premises and lazy calculations. In truth, debt can lower the hurdle rate for some companies, but almost entirely because of the tax subsidy feature, not because it is cheaper, but it can just as easily increase the hurdle rate for others, as distress risk outweighs the tax benefits. (More on that issue in a future data update post...)
I know that many of you are not fans of modern portfolio theory or betas, but ultimately, there is no way around the requirement that you need to measure how risky a business, relative to other businesses. I am a pragmatist when it comes to betas, viewing them as relative risk measures that work reasonably well for diversified investors, but I have also been open about the fact that I will take an alternate measure of risk that accomplishes the same objective.
To illustrate how costs of capital can vary across businesses, I used a very broad classification of global companies into sectors, and computed the cost of capital at the start of 2021, in US $ terms, for each one:
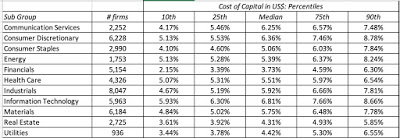
If you prefer a more granular breakdown, I estimate costs of capital by industry (with 95 industry groupings) in US $ and you can find the links here. (US, Europe, Emerging Markets, Japan, Australia/NZ & Canada, Global)
2. Geography
As a business, should you demand a higher US $ hurdle rate for investing in a project in Nigeria than the US $ hurdle rate you would require for an otherwise similar project in Germany? The answer, to me, seems to be obviously yes, though there are still some who argue otherwise, usually with the argument that country risk can be diversified away. The vehicle that I use to convey country risk into hurdle rates is the equity risk premium, the price of risk in equity markets, that I talked about in my earlier post on the topic. In that post, I computed the equity risk premium for the S&P 500 at the start of 2021 to be 4.72%, using a forward-looking, dynamic measure. If you accept that estimate, a company looking at a project in the US or a geographical market similar to the US in terms of country risk, would accept projects that delivered this risk premium to equity investors.
But what if the company is looking at a project in Nigeria or Bangladesh? To answer that question, I estimate equity risk premiums for almost every country in the world, using a very simple (or simplistic) approach. I start with the 4.72%, my estimate of the US ERP, as my base premium for mature equity markets, treating all Aaa rated countries (Germany, Australia, Singapore etc.) as mature markets. For countries not rated Aaa, I use the sovereign rating for the country to estimate a default spread for that country, and scale up that default spread for the higher risk that equities bring in, relative to government bonds.

That additional premium, which I call a country risk premium, when added to the US ERP, gives me an equity risk premium for the country in question.
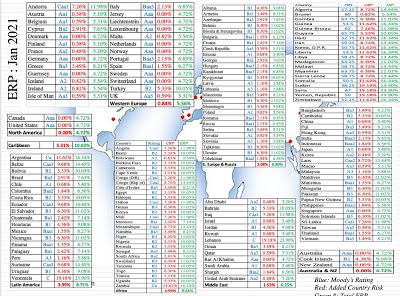
What does this mean? Going back to the start of this section, a company (say Ford) would require a higher cost of equity for a Nigerian project than for an equivalent German project (using a US $ risk free rate of 1% and a beta of 1.1 for Ford).
- Cost of equity in US $ for German project = 1% + 1.1 (4.72%) = 6.19%
- Cost of equity in US $ for a Nigerian project = 1% + 1.1 (10.05%) = 12.06%
The additional 5.87% that Ford is demanding on its Nigerian investment reflects the additional risk that the country brings to the mix.
3. Currency
I have studiously avoided dealing with currencies so far, by denominating all of my illustrations in US dollars, but that may strike some of you as avoidance. After all, the currency in Nigeria is the Naira and in Germany is the Euro, and you may wonder how currencies play out in hurdle rates. My answer is that currencies are a scaling variable, and dealing with them is simple if you remember that the primary reason why hurdle rates vary across currencies is because they bring different inflation expectations into the process, with higher-inflation currencies commanding higher hurdle rates. To illustrate, if you assume that inflation in the US $ is 1% and that inflation in the Nigerian Naira is 8%, the hurdle rate that we computed for the Nigerian project in the last section can be calculated as follows:
- Cost of equity in Naira for Nigerian project (approximate) = 12.06% + (8% - 1%) = 19.06%
- Cost of equity in Naira for Nigerian project (precise) = 1.1206 * (1.08/1.01) -1 = 19.83%
In effect, the Nigerian Naira hurdle rate will be higher by 7% (7.77%) roughly (precisely) than a US $ hurdle rate, and that difference is entirely attributable to inflation differentials. The instrument that best delivers measures of the expected inflation is the riskfree rate in a currency, which I compute by starting with a government bond rate in that currency and then cleaning up for default risk. At the start of 2021, the riskfree rates in different currencies are shown below:
These risk free rates are derived from government bond rates, and to the extent that some of the government bonds that I looked at are not liquid or widely traded, you may decide to replace those rates with synthetic versions, where you add the differential inflation to the US dollar risk free rate. Also, note that there are quite a few currencies with negative risk free rates, a phenomenon that can be unsettling, but one you can work with, as long as you stay consistent.
Implications
As we reach the end of this discussion, thankfully for all our sakes, let's look at the implications of what the numbers at the end of 2020 are for investors are companies.
1. Get currency nailed down: We all have our frames of reference, based often upon where we work, and not surprisingly, when we talk with others, we expect them to share the same frames of reference. When it comes to hurdle rates, that can be dangerous, since hurdle rates will vary across currencies, and cross-currency comparisons are useless. Thus, a 6% hurdle rate in Euros may look lower than a 12% hurdle rate in Turkish lira, but after inflation is considered, the latter may be the lower value. Any talk of a global risk free rate is nonsensical, since risk free rates go with currencies, and currencies matter only because they convey inflation. That is why you always have the option of completely removing inflation from your analysis, and do it in real terms.
2. A low hurdle rate world: At the start of 2021, you are looking at hurdle rates that are lower than they have ever been in history, for most currencies. In the US dollar, for instance, a combination of historically low risk free rates and compressed equity risk premiums have brought down costs of capital across the board, and you can see that in the histogram of costs of capital in US $ of US and global companies at the start of 2021:
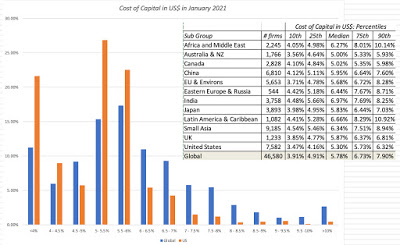
The median cost of capital in US $ for a US company is 5.30%, and for a global company is 5.78%, and those numbers will become even lower if you compute them in Euros, Yen or Francs. I know that if you are an analyst, those numbers look low to you, and the older you are, the lower they will look, telling you something about how your framing of what you define to be normal is a function of what you used to see in practice, when you were learning your craft. That said, unless you want to convert every company valuation into a judgment call on markets, you have to get used to working with these lower discount rates, while adjusting your inputs for growth and cash flows to reflect the conditions that are causing those low discount rates. For companies and investors who live in the past, this is bad news. A company that uses a 15% cost of capital, because that is what it has always used, will have a hard time finding any investments that make the cut, and investors who posit that they will never invest in stocks unless they get double digit returns will find themselves holding almost mostly-cash portfolios. While both may still want to build a buffer to allow for rising interest rates or risk premiums, that buffer is still on top of a really low hurdle rate and getting to 10% or 15% is close to impossible.
3. Don't sweat the small stuff: I spend a lot of my time talking about and doing intrinsic valuations, and for those of you who use discounted cash flow valuations to arrive at intrinsic value, it is true that discount rates are an integral part of a DCF. That said, I believe that we spend way too much time on discount rates, finessing risk measures and risk premiums, and too little time on cash flows. In fact, if you are in a hurry to value a company in US dollars, my suggestion is that you just use a cost of capital based upon the distribution in the graph above (4.16% for a safe company, 5.30% for an average risk company or 5.73% for a risky company) as your discount rate, spend your time estimating revenue growth, margins and reinvestment, and if you do have the time, come back and tweak the discount rate.
I know that some of you have been convinced about the centrality of discount rates by sensitivity analyses that show value changing dramatically as discount rates changes. These results are almost the consequence of changing discount rates, while leaving all else unchanged, an impossible trick to pull off in the real world. Put simply, if you woke up tomorrow in a world where the risk free rate was 4% and the cost of capital was 8% for the median company, do you really believe that the earnings and cash flows you projected in a COVID world will remain magically unchanged? I don't!
Related: The Price-Value Feedback Loop: A Look at GME and AMC!
