Last week was again all about the trade war heating up between China and the US as well as internal political tensions as the Senate voted to reinstate the ban on ZTE sales, a clear challenge to President Trump. That led to a spike in CBOE S&P 500 Volatility Index (VIX) futures early in the week with the index up over 20% in the past five trading days as of Thursday’s close.
The Markets
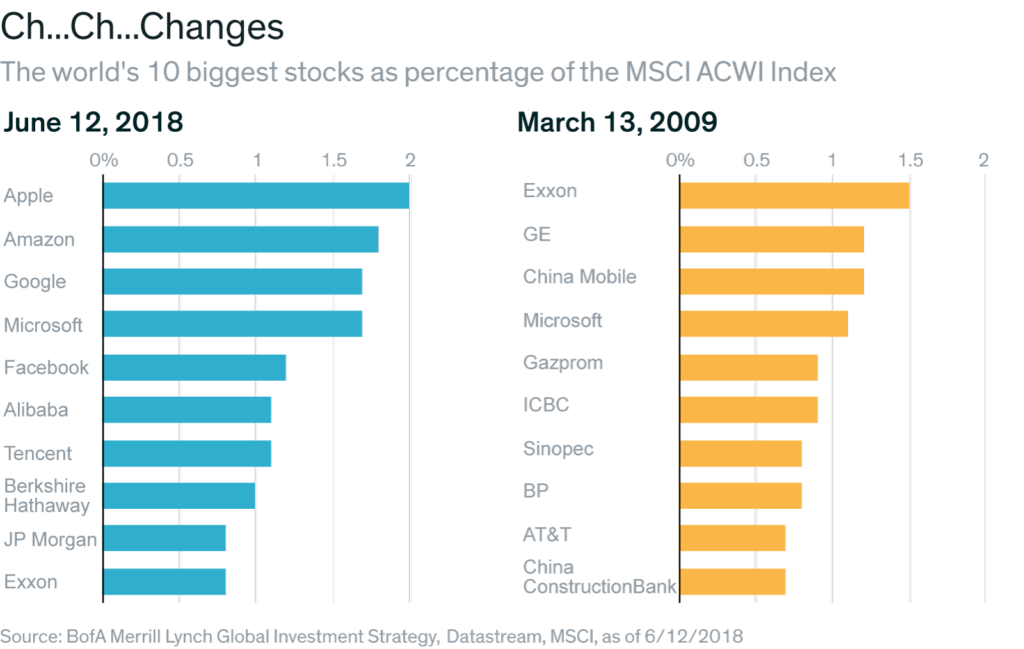
With the exception of the Russell 2000, the major equity market indices have all declined over the past week. On Tuesday the Dow Jones Industrial Average moved into the red for the year and by Thursday’s close was down 1% from the start of the year. Conversely, the small cap Russell 2000 and the Nasdaq Composite were both up over 11% for 2018 as of Thursday’s close, with the S&P 500 lagging well behind at up 2.9%. The Russell 2000 index reached a new high Wednesday. The story here has been tech and a shift towards domestically focused, small cap as the global trade war heats up and the dollar strengthens. The chart below shows just how powerful the tech sector has become with 7 of the 10 biggest stocks in the world tech-based.

If we dig into the details, the underlying market dynamics are very telling. The median stock (ex-tech) is down 5% from the late January peak and down 40 basis points year-to-date. Nearly 70% of the S&P 500 is trading below their late January peaks and around half of the S&P 500 is 10% below their 52-week highs. The S&P 500 has not made a new high in almost 5 months and the forward P/E has compressed from 20x to just over 17x. This suggests to us here at Tematica that confidence in robust earnings expectations is waning as trade war and tariffs escalate.
Related: Is There Only a Little Left in This Expansion?
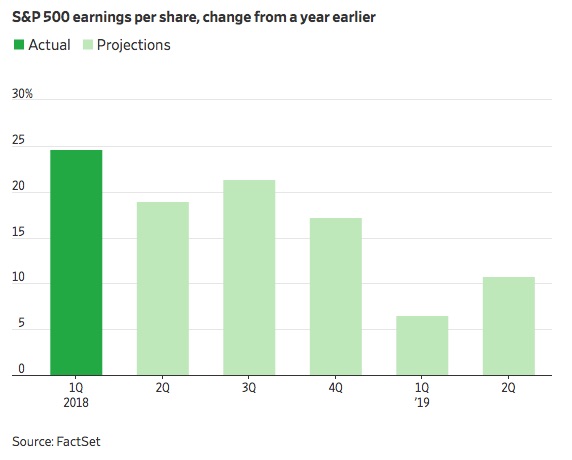
While the headlines tell us that the economy is booming and expectations for Q2 GDP growth are well over 4%, the bond market isn’t buying it with the 10-year U.S. Treasury yield, (a proxy for longer-term GDP growth expectations) remaining stubbornly below 3% while GDP estimates are being revised up. Talk about a disconnect. Q2 GDP is still looking like it will be pretty solid, but according to FactSet, corporate earnings growth has already peaked.

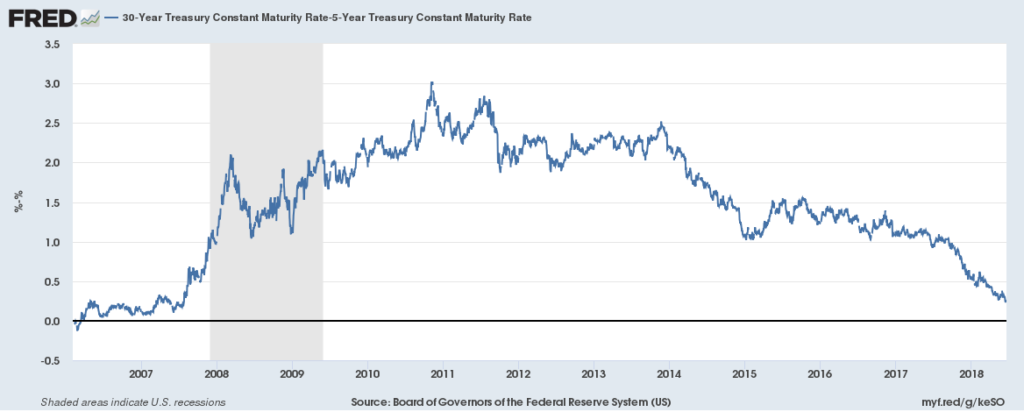
While the Fed is expecting that it will hike rates four times this year, we are seeing the yield curve continue to flatten as short-term rates rise, but the longer-term rates remain low. The 1-month Treasury bill yield hit a multi-year high this week, bringing the spread between it and the S&P 500 dividend yield down near zero for the first time in 10 years. The spread between the 30-year Treasury yield and the 5-year Treasury yield is down to a level not seen since 2007.

Stepping outside the domestic market, emerging markets are down about 17% this year, as measured by the MSCI Emerging Markets iShares ETF (EEM) versus a 4% loss for foreign developed markets, as measured by the SPDR® Portfolio Developed World ex-US ETF (SPDW). The EEM is down to its lowest level in nine months and is trading below its 200-day moving average with its 50-day below its 200-day – not looking so good as the dollar continues to strengthen and that dollar carry-trade is being forcefully unwound.
The escalating trade war has been a major headwind to commodities linked to trade between the U.S. and China. For example, soybeans, high-protein wheat, cotton and industrial metals in the U.S. saw significant price declines this week. The Bloomberg Agricultural Index has hit its lowest level in years. Shares of Industrial companies have likewise taken a beating as trade tension rise. So far the trade war has led to tariffs on steel and aluminum as of June 1 st . On July 6 th additional tariffs of 25% are to be imposed on 818 products from China amounting to $34 billion in goods with another $16 billion planned after a public hearing period, for a total of $50 billion. If China retaliates, President Trump has pledged to impose tariffs on an additional $200 billion of imports from China into the US by September/October. Threats have also been tossed out concerning 20% tariffs on European cars and auto parts.
All this helps explain the gap up in the VIX I mentioned at the outset of this week’s Weekly Wrap. As we all know, uncertainty is not a friend of investors or the stock market.
Related: Goldilocks Expectations Are Meeting up Against Some Tough Realities
The Economy
It was a relatively light week for economic data but what we received was a mixed bag with fresh signs that consumer buying power is not keeping pace with the mounting inflationary pressures. Sad to say but that confirms our Middle-Class Squeeze investing theme. Now for the specifics…
The Philadelphia Fed Manufacturing Index fell to a 19-month low in June, down to 19.9 versus 34.4 in May and expectations for 28. The biggest source of the drop came from new-orders index, which dropped by almost 23 points to 17.9. Expectations for activity in the next six months dropped for the third consecutive month. In contrast, the Empire State Factory Index from last week had hit an eight-month high of 25 in June, up from 20.1 in May and beating expectations for 18.8. The really good news in this report came from New Orders which rose significantly during the month. Mixed messages here so we’ll be looking to next week’s reports from the Richmond and Dallas Feds for more insight.
Housing Starts hit the highest level in years in May, but that may be misleading as the reading was elevated from weather-induced delays in April. Residential building permits have been slowing, with new permits coming in below expectations. On the other hand, multi-family housing construction remains strong. Existing home sales have stalled out and inventory of existing homes for sale is at multi-year lows for this time of year.
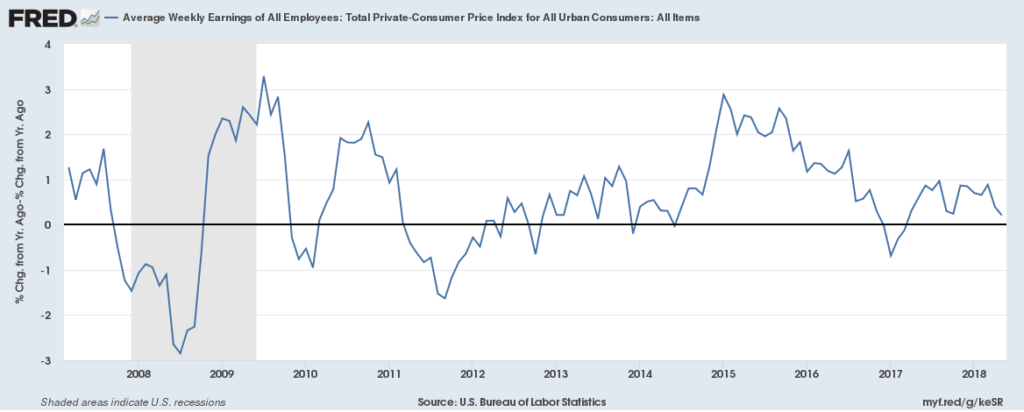
Yes, we are seeing some wage pressures, but they aren’t accelerating nor are they translating into better take-home pay thanks to inflationary pressures.
![]()

Putting It All Together
Portions of the US equity markets continue to be in correction mode in the near-term but remain within their longer-term upward trends. The strong dollar and trade wars have pushed small cap stocks to outperform. Overall corporate guidance remains strong, outside of those most immediately affected by the trade wars, i.e. industrials. The domestic economy remains strong and employment is robust. While there are signs of rising inflation, they remain fairly muted by historical standards. Investor sentiment is not overly bullish and while the economy is likely slowing, we see no imminent signs of a recession.
Global growth is decidedly slowing, and we have record high levels of debt around the world. The cost of capital for corporations is now higher than the return on capital at a time when we have record level corporate debt in a rising rate environment with mid-term elections right around the corner amidst a presidency facing increasing resistance, even from within the Republican party – that was a mouthful even for me! Keep in mind too that corporate cash net of corporate debt securities and loans has fallen to a new all-time low of -$6.4 trillion, (more than 1/3 rd of GDP). That rising rate environment is particularly concerning when we look at the total of Federal, State and Local Government; Corporate; Mortgage; and Personal Interest Payments that has hit a record $1.8 trillion at a seasonally adjusted annual rate. These payments are just $100 billion less than Total US Corporate Profits and greater than the total of all individual tax receipts in the US – rate hikes matter people!
Looking Ahead
This week we’ll get the Chicago Fed National Activity Index for May, after having seen little change in economic growth in April. We’ll also get more on housing with New Home Sales for May, the S&P/Case-Shiller Home Price Indices for April Pending Home Sales for May.
We’ll also get the Richmond Fed Manufacturing Index and the Dallas Fed Manufacturing Business Index, which we’ll be looking at for more insight into the impact of the trade wars and for clarification, as mentioned earlier, from this week’s conflicting manufacturing reports. Later in the week, we’ll get May’s Wholesale Inventories and Durable Goods Orders. Friday we’ll see Personal Consumption Expenditures for May, along with Personal Income and Personal Spending to give us insight into the consumer.
This week also closes out the month of June and 2Q 2018. Over the coming days, we’ll begin to hear from companies reporting their latest quarterly results and those comments will set the stage for the ensuing onslaught of reports to come. On the docket next week are homebuilders Lennar (LEN) and KB Home (KBH), food companies General Mills (GIS:NYSE) and ConAgra (CAG:NYSE), Sonic (SONC:Nasdaq) and Rite Aid (RAD:NYSE). Two of the higher profile reports will be Nike (NKE:NYSE) and Constellation Brands (STZ:NYSE).
Across all of these reports, team Tematica will be listening for factors driving revenue but also costs. In the March quarter earnings, many investors were caught off guard by rising costs that included freight and transportation as well as various commodities. With more signs of inflation cropping up over the last few months, we’ll be looking to hear from companies on their abilities to absorb those costs as well as expectations for price increases to offset them. Along those lines, this weekend’s OPEC meeting will be one to watch closely as upsized oil production levels from the OPEC countries is likely to lead to lower oil and gas prices. We’ll also be tuning into trade and tariff comments to be had as well next week, assessing how the market may need to re-adjust its expectations for the back half of 2018.


