
Trending

Written By: Chris Vermeulen Recently, we openly discussed the potential for global turmoil related to Europe, Asia, China, and South America. The issues before the globe are that the global economy may not be firing in sync and that there are credit and debt, as well as geopolitical, issues that persist. The interesting component of all of this is that the US stock market has staged a very impressive recovery over the past two weeks that have shocked even the best Wall Street analysts and researchers. While the US recovered from elections, the Fed, FANG price collapse and a Government Shutdown, the US stock markets appeared to be falling off a cliff. Then, almost exactly on Christmas Eve, the markets turned around – even in the midst of all of this uncertainty.Now, nearly 3 weeks after Christmas, the US stock market appears to be shaking off the negativity and headed for higher price levels. China announced a plan to eliminate the trade barriers between the US by providing a 10-year plan to gradually eliminate any US trade deficit. Even though China has discussed this plan before, the US stock market ate it up like a starving man on a deserted island. The ES rallied over 3.35% this week. The NQ rallied over 3.0% and the YM rallied over 3.25% week.
SP500 Daily Chart
We are still expecting some decent price rotation over the next couple weeks, but the markets could continue to push higher attempting to reach our Upside Target Zone without any real break. Right now, it appears any decent earnings, even a “miss”, or any moderately good news is going to be eaten up by this market that just wants to rally.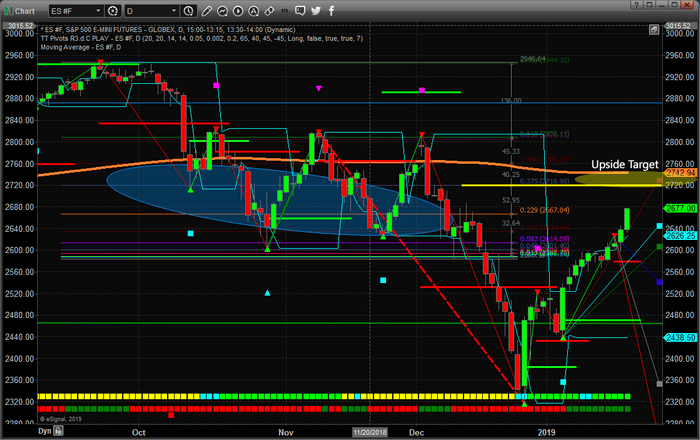
ES Monthly Chart
This ES Monthly chart showing our TT Charger modeling system show the system never flipped into a bearish mode and that the Range Level on this chart is suggesting the markets could rally back to near all-time highs again. Of course, this could be many months into the future. Still, it appears the upside move is far from over as we expect a multi-month sideways/higher price as the market determines if we are still in a bull market or bear market.
NQ Monthly Chart
This NQ Monthly chart showing our TT Charger modeling system continues to suggest the bullish trend is intact and shows deeper support. This would indicate that the recent price rotation was now a severe risk in the technology sector and could have been a capital rotation/revaluation that was needed after such a massive upside price swing. Either way, we need to understand the bias is neutral long term here. This is much like what we say in 2015 when the market was on the verge of a bear market, but Trump was elected and we had the presidential rally save the market until now.Related: Could This Be 2008 All Over Again?What will save the market this time around? The US markets appear to still be bullish based on our longer-term modeling systems. Any real positive news (a deal with China, a Brexit deal, increased US economic output and/or any resolution to geopolitical issues) could be a catalyst for an explosive upside move.Friday's pop/rally proves this point clearly. Just the “hint” of some type of deal with China, even though it was nothing more than a whisper of some 10-year plan to gradually try to balance trade issues, resulted in a 1.25%+ upside move across the board. Imagine what could happen with some real positive news.Pay attention to these markets moves. 2019 is poised to be a very exciting and profitable year for skilled traders and wise investors. Visit www.TheTechnicalTraders.com to get our daily and weekly analysis forecast complete with long term investing swing trading, and index day trade signals.53 years experience in researching and trading makes analyzing the complex and ever-changing financial markets a natural process. We have a simple and highly effective way to provide our customers with the most convenient, accurate, and timely market forecasts available today. Our index, stock and ETF trading alerts are readily available through our exclusive membership service via email and SMS text. Our newsletter, Technical Trading Mastery book , and 3 Hour Trading Video Course are designed for both traders and investors. Also, some of our strategies have been fully automated for the ultimate trading experience. DISCLOSURE: no positions in sp500 or nasdaq