
Trending

Despite some fearmongering in the media, the longshoremen strike, shutting down 14 major East Coast ports, is unlikely to have severe economic repercussions or result in a 2021-2022-like jump in inflation. Estimates suggest the economy could lose between $4 to $8 billion of economic activity each week the strike continues. America’s latest GDP figure was $29 trillion annually. Assuming the $8 billion upper end of the forecast, each week the port strike lasts, GDP will decrease by .027%. Even if the port strike lasts an entire quarter, it will only shave a third of a percent from GDP. Keep in mind that, for the most part, economic activity is not lost due to the strike; it’s just delayed.
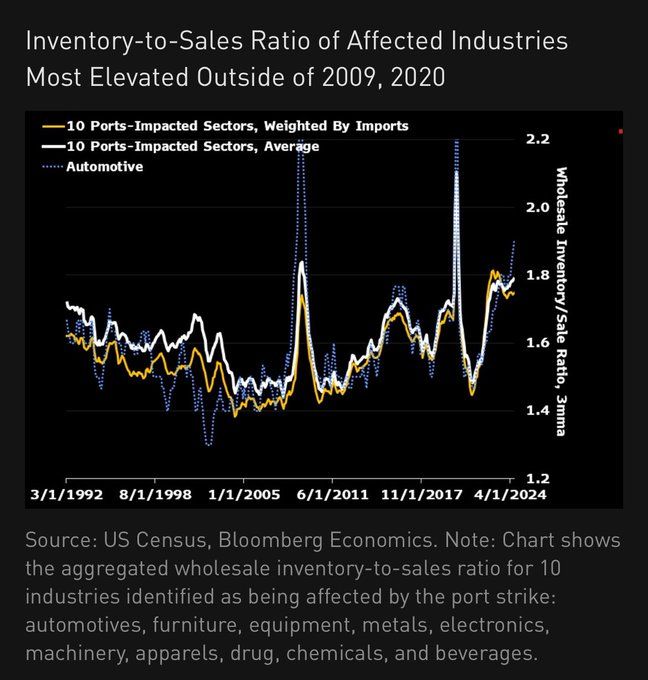
The other fear is that shipping delays and shortages could increase inflation. There is a growing likelihood that if the strike continues, the supply of some goods, especially food, autos, and electronics, will decline, which may cause temporary price increases. However, unlike what we witnessed a couple of years ago, the demand for goods is not grossly elevated, and all other supply chains fully function. Furthermore, as the Bloomberg graph below shows, the inventory-to-sales ratio of affected industries is the most elevated except for 2009 and 2020. With excess inventories to help offset reduced supply and normal levels of demand, the odds of the strike creating systematic inflation are small. That said, the prices of some goods, especially food items that spoil quickly, could temporarily increase.
It is also important to note that if the port strike does last a while, the Fed and markets will look at data sans the strike effects. They will consider it temporary, as they often do with severe storms that can economically cripple a region.
What To Watch
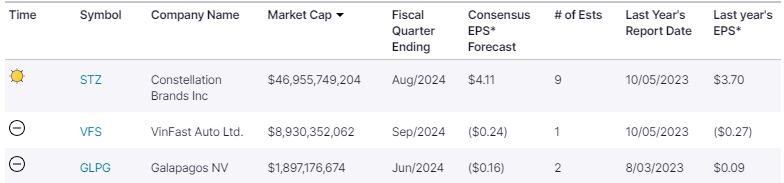
Earnings
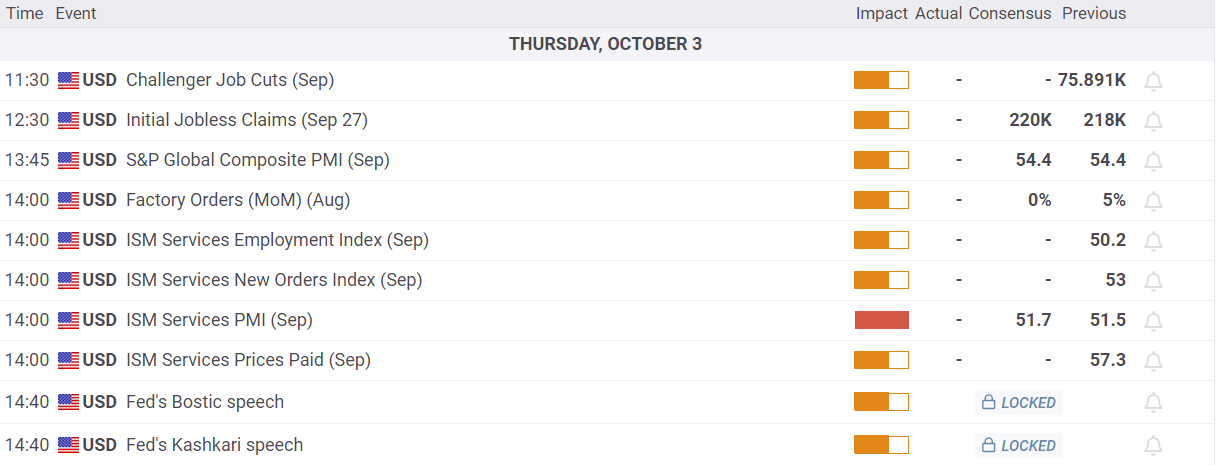
Economy
Market Trading Update
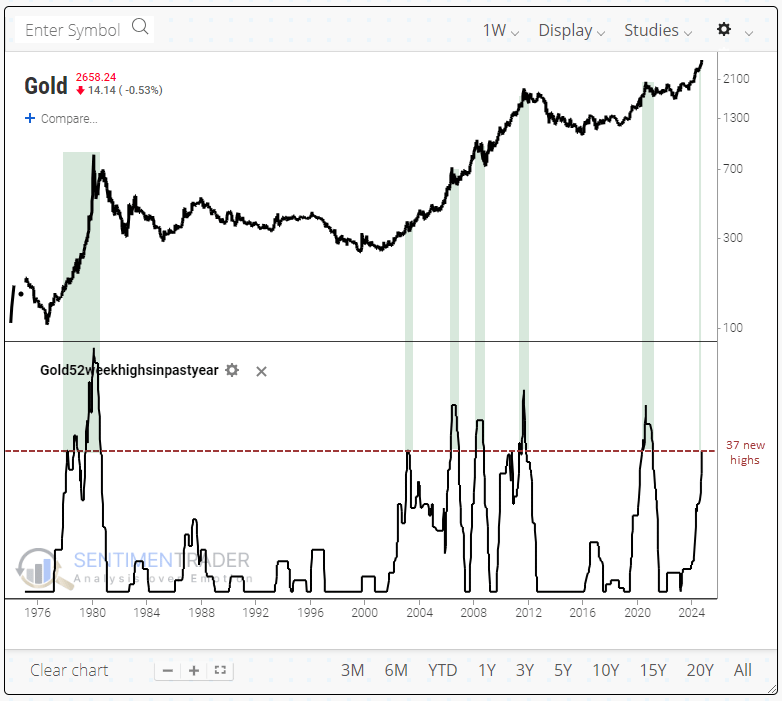
In yesterday’s note, we discussed the surge in oil prices due to the Iran/Israel escalation. Regarding commodities, prices are not set by just economic supply/demand factors. Prices are set primarily by futures traders on the NYMEX, which makes prices quite detached from long-term means. I recently touched on this issue relating to Gold prices, but I thought this recent analysis for Sentiment Trader affirmed what my previous analysis suggested.
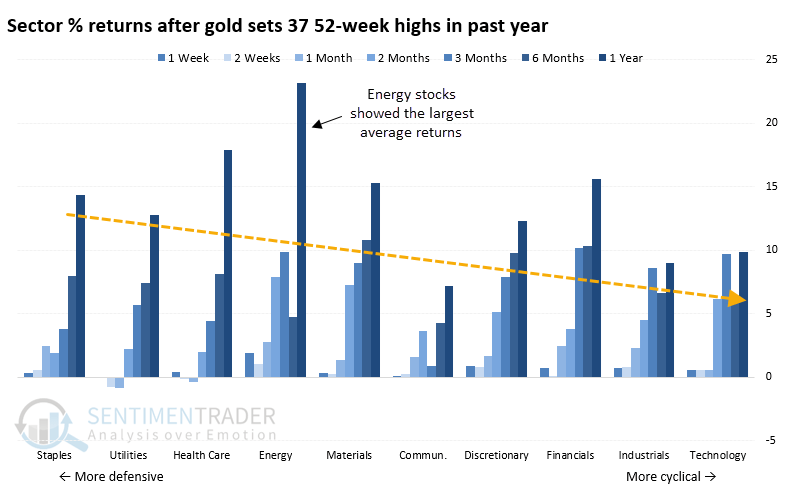
“Despite a jump on renewed geopolitical tensions, gold didn’t quite reach another record high on Tuesday. Even so, it remains oh-so-close and on the cusp of adding to its 37 new highs in the past year, similar to a stretch in early 2020. A rolling one-year total of 37 new 52-week highs is impressive. During the past 50 years, there haven’t been many streaks like this, most confined to the great bull runs of the late 1970s and early 2000s.”
“The overall suggestion for gold investors is that more gas should be in the tank before a substantial pullback. There are many trend-following systems to help determine when that exit signal might occur, but using a simple 50-day moving average proved to be an okay heads-up that the momentum had run its course.“
Soaring gold prices always unnerve equity investors, who think that “gold knows something,” which makes people nervous about their stocks. However, there isn’t much to that theory. In reality, gold prices are usually a reflection of increasing bullish sentiment. As shown, all sectors tend to perform well after a surge in gold prices, with energy outperforming the most.
As we discussed in the “Everything Market,” the recent surge in gold prices reflects increasing bullish sentiment and too much money chasing too few assets.
Sentiment Trader concludes:
“Sentiment has become extremely optimistic, which is troublesome because its returns have been poor after extremes like this. Even so, there are times when momentum rules all and can steamroll sentiment or any other factor. We seem to be in one of those moments.”
Trade accordingly.
Oil And Bonds
Our recent Commentary from September 27 discussed a rumored breakdown of OPEC. The rumor came as oil prices traded bearishly and sat on critical support. Over the last two days, oil prices have surged on escalating concerns regarding Israel and Iran. Both the trend lower and the recent price spike have implications for inflation and, therefore, bond yields.
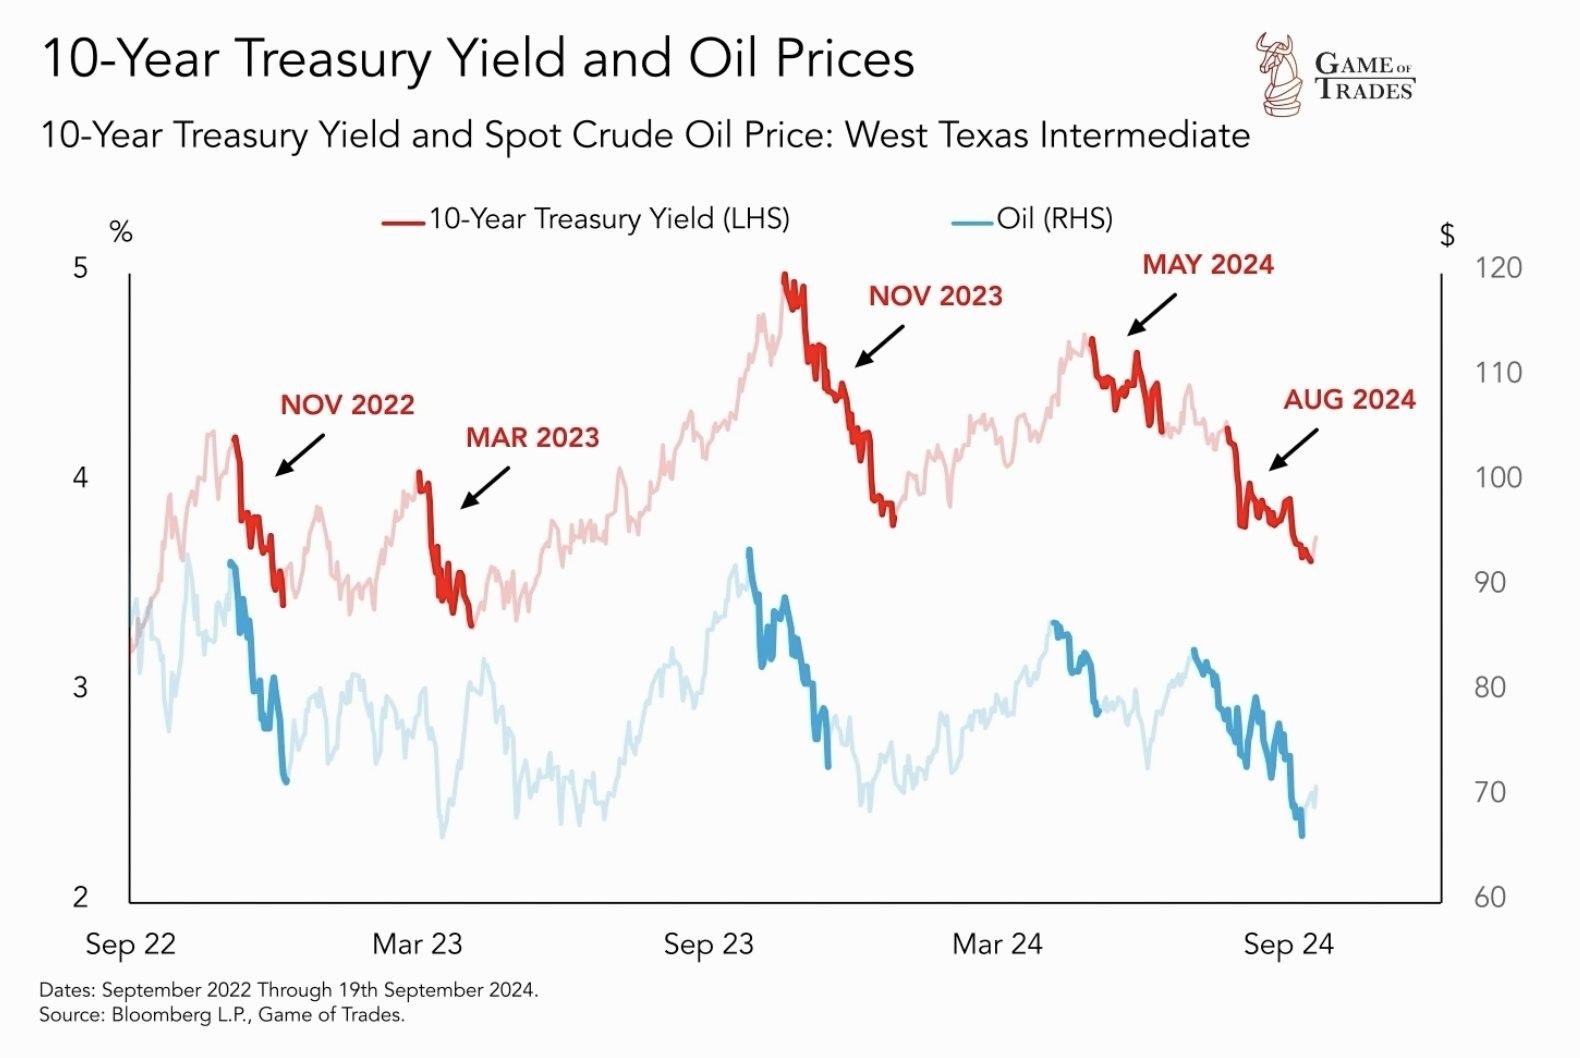
Oil prices and inflation often have a strong correlation. Accordingly, when inflation runs higher than average, the change in oil prices can significantly impact bond yields. The first graph below, courtesy of Game of Trades, shows that during the recent period of heightened inflation awareness, sizeable declines in the price of crude oil aligned with decreases in bond yields. The second graph from Game of Trades shows that stocks do well when oil prices have fallen over the last year. This, too, makes sense as lower oil prices lead to lower inflation. Moreover, lower inflation leads to Fed rate cuts. Maybe the recent stock market rally is due to weaker oil prices and its impact on inflation and, ultimately, the Fed.
If the Middle East conflict is relatively short-lived and the trend lower in oil prices resumes, stocks and bonds may continue to do well. However, investors should manage risk carefully if hostilities escalate and the Iranian oil supply is threatened.

The Crystal Ball Challenge
A crystal ball would be an excellent addition to our market analysis arsenal. Advanced knowledge of market, economic, political conditions, and other events would likely positively impact our performance. The impact, however, would be over the longer run, not in the returns immediately following the foreseen events. Trading on a short-term basis with no context can be hazardous to your wealth.
Furthermore, assumptions of a specific result due to particular news are often faulty. As the old saying goes- buy the rumor, sell the news!

Tweet of the Day

“Want to achieve better long-term success in managing your portfolio? Here are our 15-trading rules for managing market risks.”