

Trending

Following the Fed’s somewhat aggressive 50 bps rate cut two weeks ago, the stock and Fed Funds futures markets started to get ahead of themselves. Accordingly, market participants expected the aggressive pace of easing to continue through the remainder of 2024. At one point the Fed Funds futures market was implying the Fed could cut rates by 100 bps in total by year end. On Monday, Powell reset market expectations, pulling up on the reins on the market’s aggressive expectations.
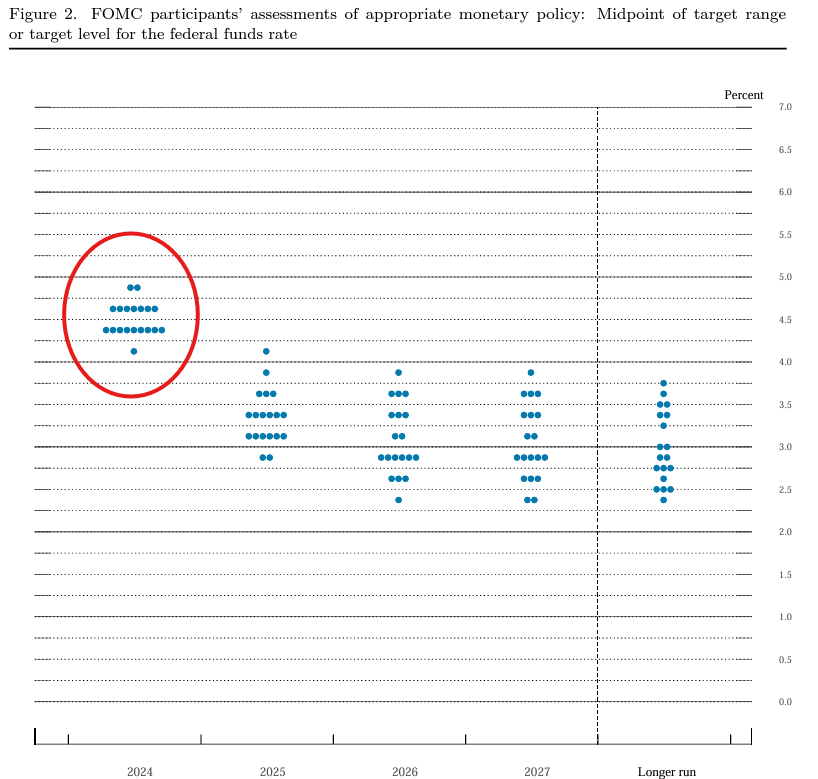
In a speech on Monday afternoon, Powell reminded investors that the Fed’s economic and interest rate projections, aka dot plots, released in mid-September, are still valid. In those projections, 18 of 19 members projected 50 bps of total rate cuts for the remainder of 2024. Instead of letting the market push the Fed into cutting by more than they wanted, Powell reset expectations with a more hawkish tone than he used at the last Fed meeting. In particular, as we quote below, he says the risks are two-sided. Such implies that there are still inflationary forces that can potentially limit the amount of easing. By resetting market expectations, Powell indirectly makes this week’s labor data all the more important. Therefore, if Friday’s BLS data is strong, the market could actually undercut the Fed and price in less than 50 bps of rate cuts through year-end.
Looking forward, if the economy evolves broadly as expected, policy will move over time toward a more neutral stance. But we are not on any preset course. The risks are two-sided, and we will continue to make our decisions meeting by meeting. As we consider additional policy adjustments, we will carefully assess incoming data, the evolving outlook, and the balance of risks. Overall, the economy is in solid shape; we intend to use our tools to keep it there. – Jerome Powell 9/30/24
What To Watch
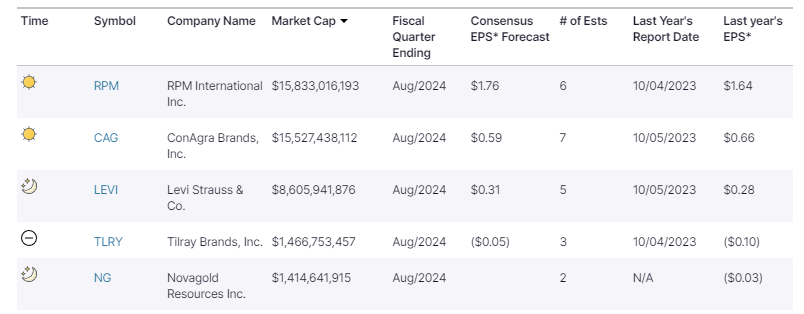
Earnings
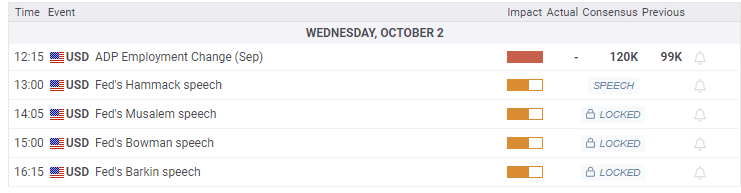
Economy
Market Trading Update
Yesterday’s commentary discussed the market breadth indicators that send both a bullish and bearish warning. Rising breadth is bullish as it signals healthy market participation. However, it is also bearish that when breadth measures are very elevated, it typically denotes that “buyers” are “all in.” When market breadth, regarding the percentage of stocks trading above respective moving averages, is high, any negative headline can spark a wave of selling. Such is what we saw yesterday as news of more saber-rattling between Iran and Israel put markets on edge.
Critically, we had previously discussed the deeply oversold conditions of the oil market and that something would occur that could spark a reversal of oil prices, forcing short-sellers to cover. The Israel/Iran news fit that bill, and oil posted sharp gains yesterday, pulling energy stocks up with them. From a technical view, both the MACD and RSI indicators are forming higher lows along with the price of oil. There is overhead resistance at the 200-DMA around $73/bbl, but a break above that level will cause a short-squeeze, moving oil prices to $77.
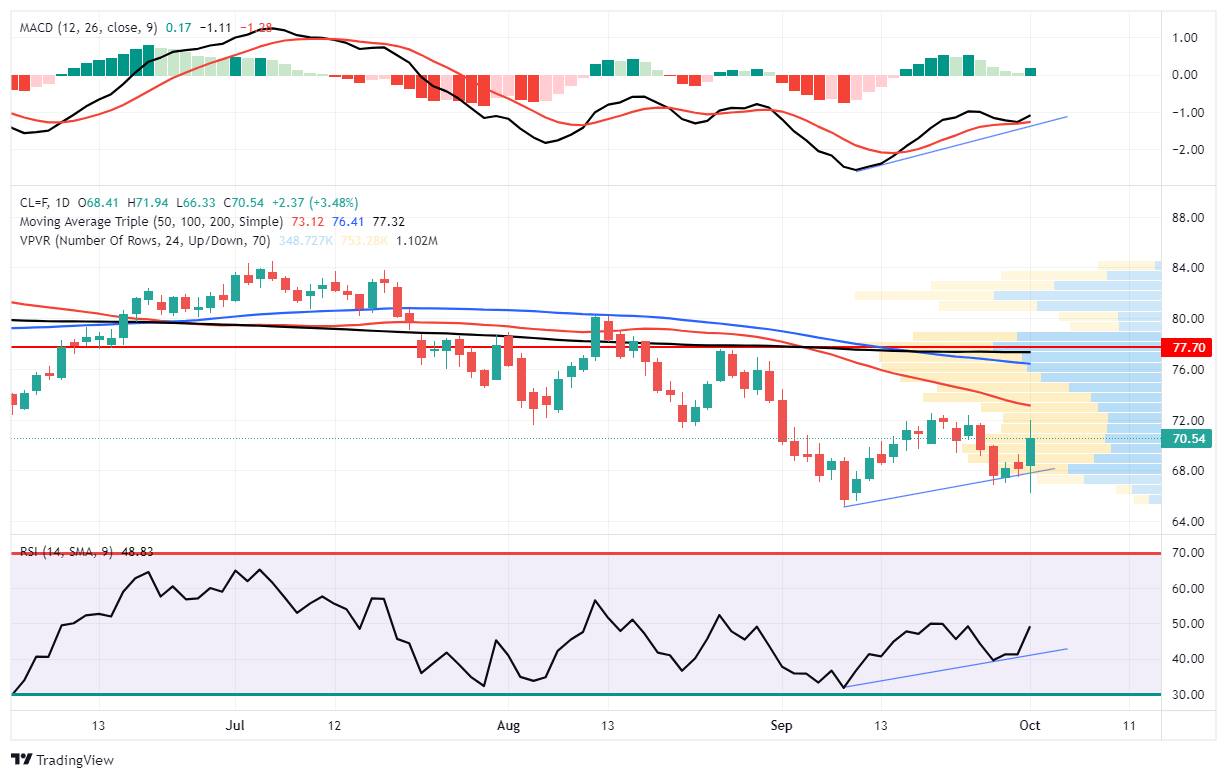
We are maintaining our long oil positions and will look for additional confirmation to add to those holdings.
Trade accordingly.
JOLTs Remains Weak Under The Hood And ISM Confirms
The headline JOLTs job openings number remains relatively strong at 8 million. That figure was up by about 300k jobs. However, under the hood, the data continues to point to growing weakness. As we share below, the new hires and quits rates continue to decline and, in both cases, are well below pre-pandemic levels. The last time the hires level was at current levels the unemployment rate stood around 8%. The way to best characterize the report is a low churn labor market. No one is hiring, firing, or quitting.
ISM Manufacturing was slightly weaker at 47.2, remaining below 50 and therefore pointing to a continued contraction of the manufacturing industry. Also closely followed within the survey are prices and employment. Prices were much cooler than expected, coming at 48.3 below estimates of 53.3 and last month’s 54.0. The employment gauge was also lower than expected at 43.9 versus the consensus estimate of 46.0. The ISM services survey on Thursday will be more telling as the services sectors represent about three-quarters of the economy.

The “Everything Market” Could Last A While Longer
When it comes to what is driving the “everything rally,” everyone has their thesis. The “stock jockeys” suggest that easier monetary accommodation by the Fed and improving earnings are the key drivers for equities. As noted above, the “gold bugs” are seduced by burgeoning government spending and expectations of a dollar decline to loft gold prices higher. Every asset class has its “reason” for going higher, but the real reason may be much simpler. This post will focus on stocks and gold as they garner the most headlines and have the most fervent of “true believers.”
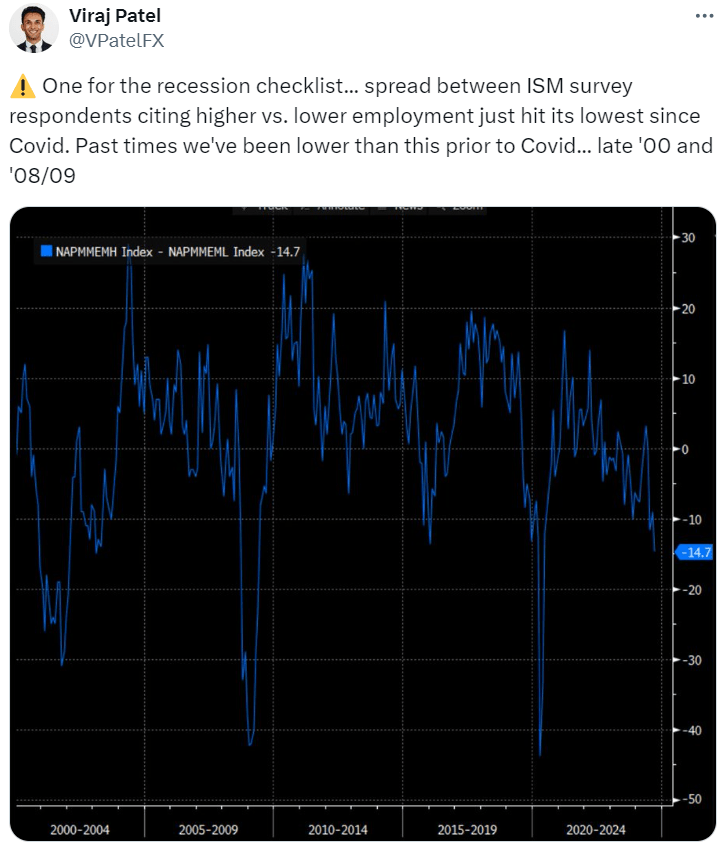
Tweet of the Day
“Want to achieve better long-term success in managing your portfolio? Here are our 15-trading rules for managing market risks.”
Related: The “Everything Market” Could Stay Strong for Longer