
Trending

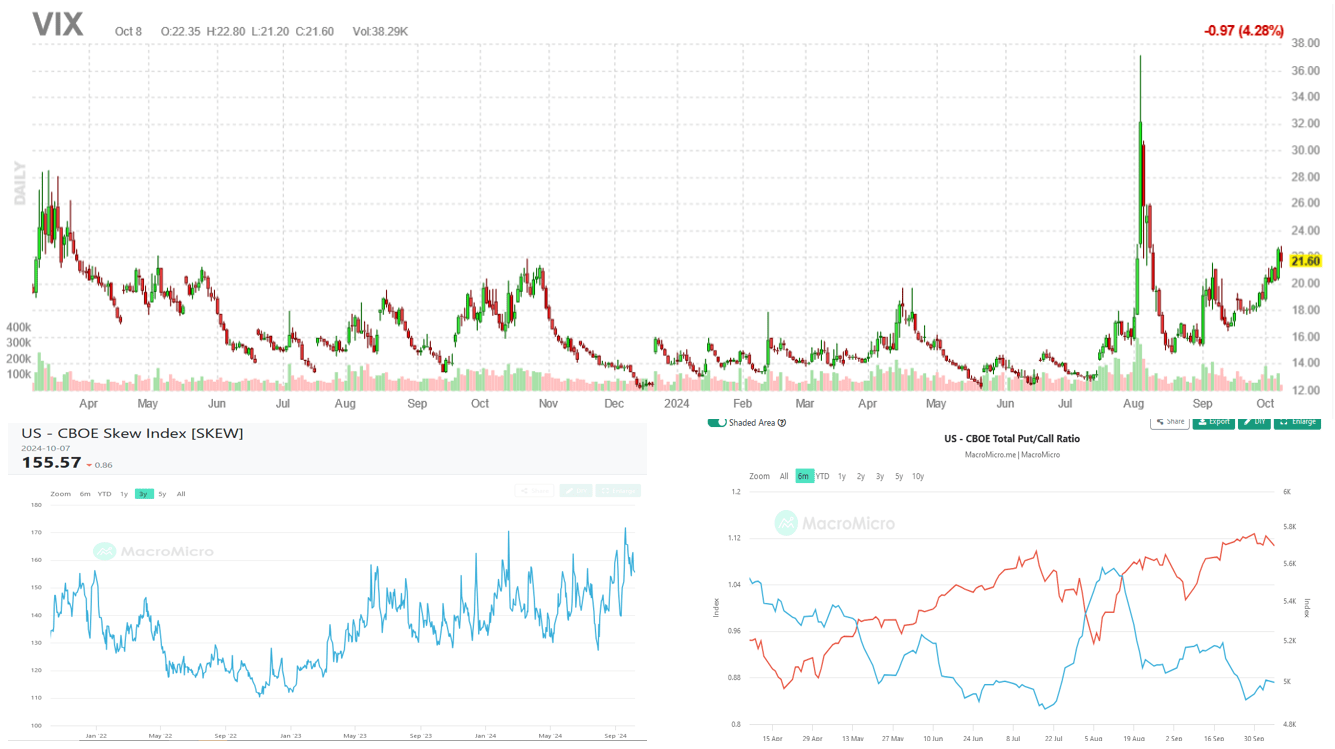
The VIX volatility index spiked on the August 5th yen carry trade sell-off and has not recovered to prior lows. Since then, it has risen steadily alongside the S&P 500. Often, the VIX declines or resides at low levels when the S&P 500 is increasing and vice versa. Might the irregular VIX/S&P 500 relationship be a warning of pending trouble? To better appreciate the volatility market, we share two other measures of volatility derived from the options markets.
The graph on the bottom left is the CBOE Skew Index. Instead of computing volatility using in-the-money options like the VIX, the Skew Index uses the prices of out-of-money, at-the-money, and in-the-money options to assess the differences in volatility. A higher skew reading means the market is assigning greater tail risk. Currently, the Skew Index assigns a greater than 15% chance of a two standard deviation move in the next thirty days. When the index is 100, the odds are only 2.30%. Despite the Skew and VIX warnings, the Put-Call Ratio shows little concern. This ratio measures put volume divided by call volume. A higher ratio indicates that bearish traders are adding protective puts more aggressively than bullish traders are buying speculative calls. That is currently not the case.
Concern is warranted with the upcoming election and decent odds of it being contested. Furthermore, there is the risk that Israel will attack Iranian oil facilities, resulting in an oil spike. Lastly, the equity markets are extended technically and fundamentally, making a correction possible. The market has ample reasons to worry and hedge its concerns. The VIX and Skew confirm that. Trade with caution!
We are writing an in-depth article on VIX and other volatility measures that will be released next week.
What To Watch
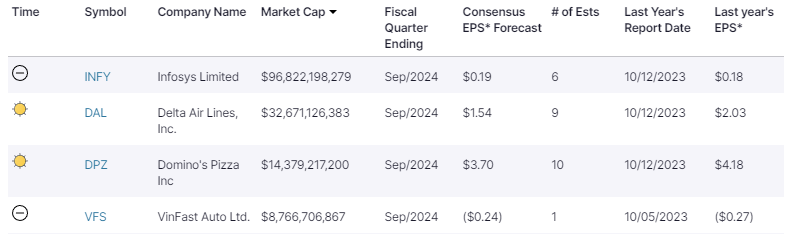
Earnings
Economy

Market Trading Update
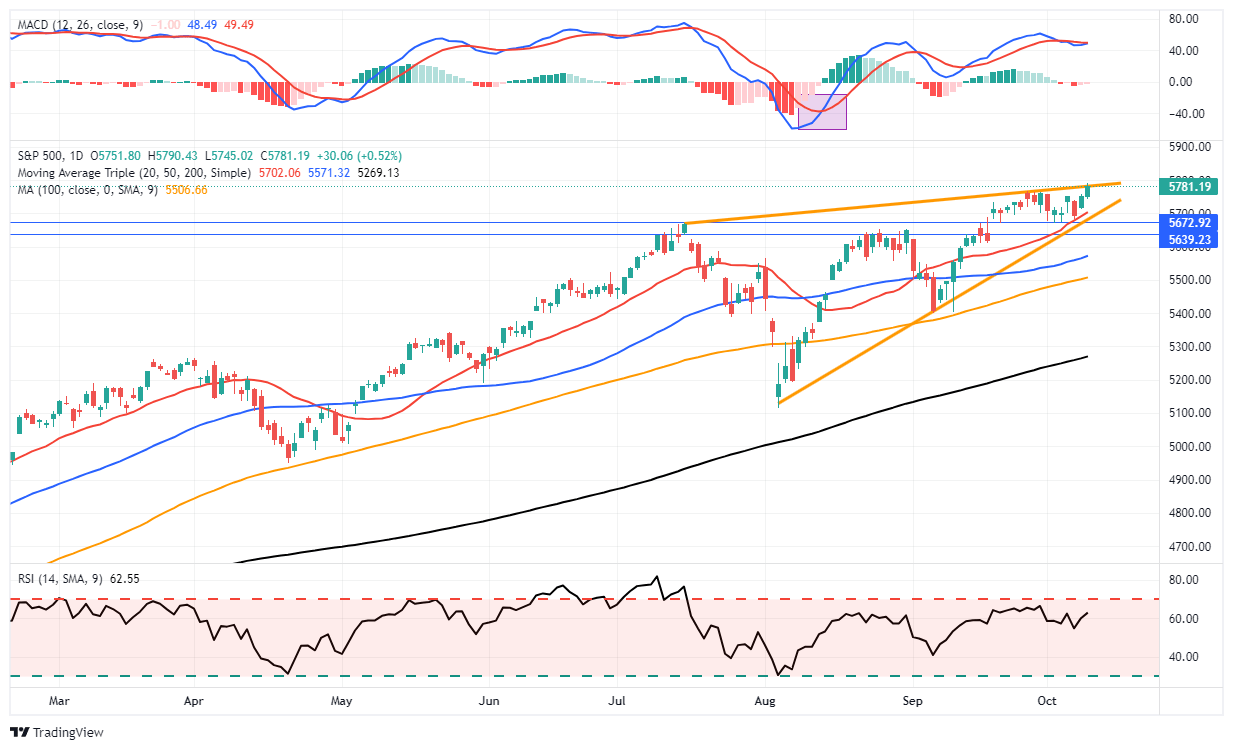
In yesterday’s update, we discussed the rise in the volatility index as it relates to the market, which suggests some caution in the near term. However, the market rallied again yesterday in anticipation of this morning’s inflation report. As with the employment report, all eyes are focused on an outcome that suggests the Fed can continue to cut interest rates. Therefore, an inline reading of 0.2% inflation growth (2.4% annualized) would be preferred. However, there is a risk to the upside, but weaker oil prices during the data collection period will likely tame this month’s report. That outcome seems to be anticipated by the market.
As shown, the market is pushing up against the top of the current rising wedge. If the market breaks to the upside today, such will also trigger a MACD “buy signal,” giving the markets some running room over the next week. However, the upside will likely be contained with the markets pushing overbought conditions. The good news, however, is that downside risk is also limited to the rising trendline and the 20-DMA for now.
With portfolios nearly fully weighted to equity exposure, there is little action to take. However, we continue to rebalance risk and allocations as needed.
What’s Next For Treasury Yields
Based on the current inflation rate and its expected downward trajectory, Treasury yields should be lower than they are. However, investors are still scarred by the recent bout of high inflation. Accordingly, they may not believe inflation will continue to decline.
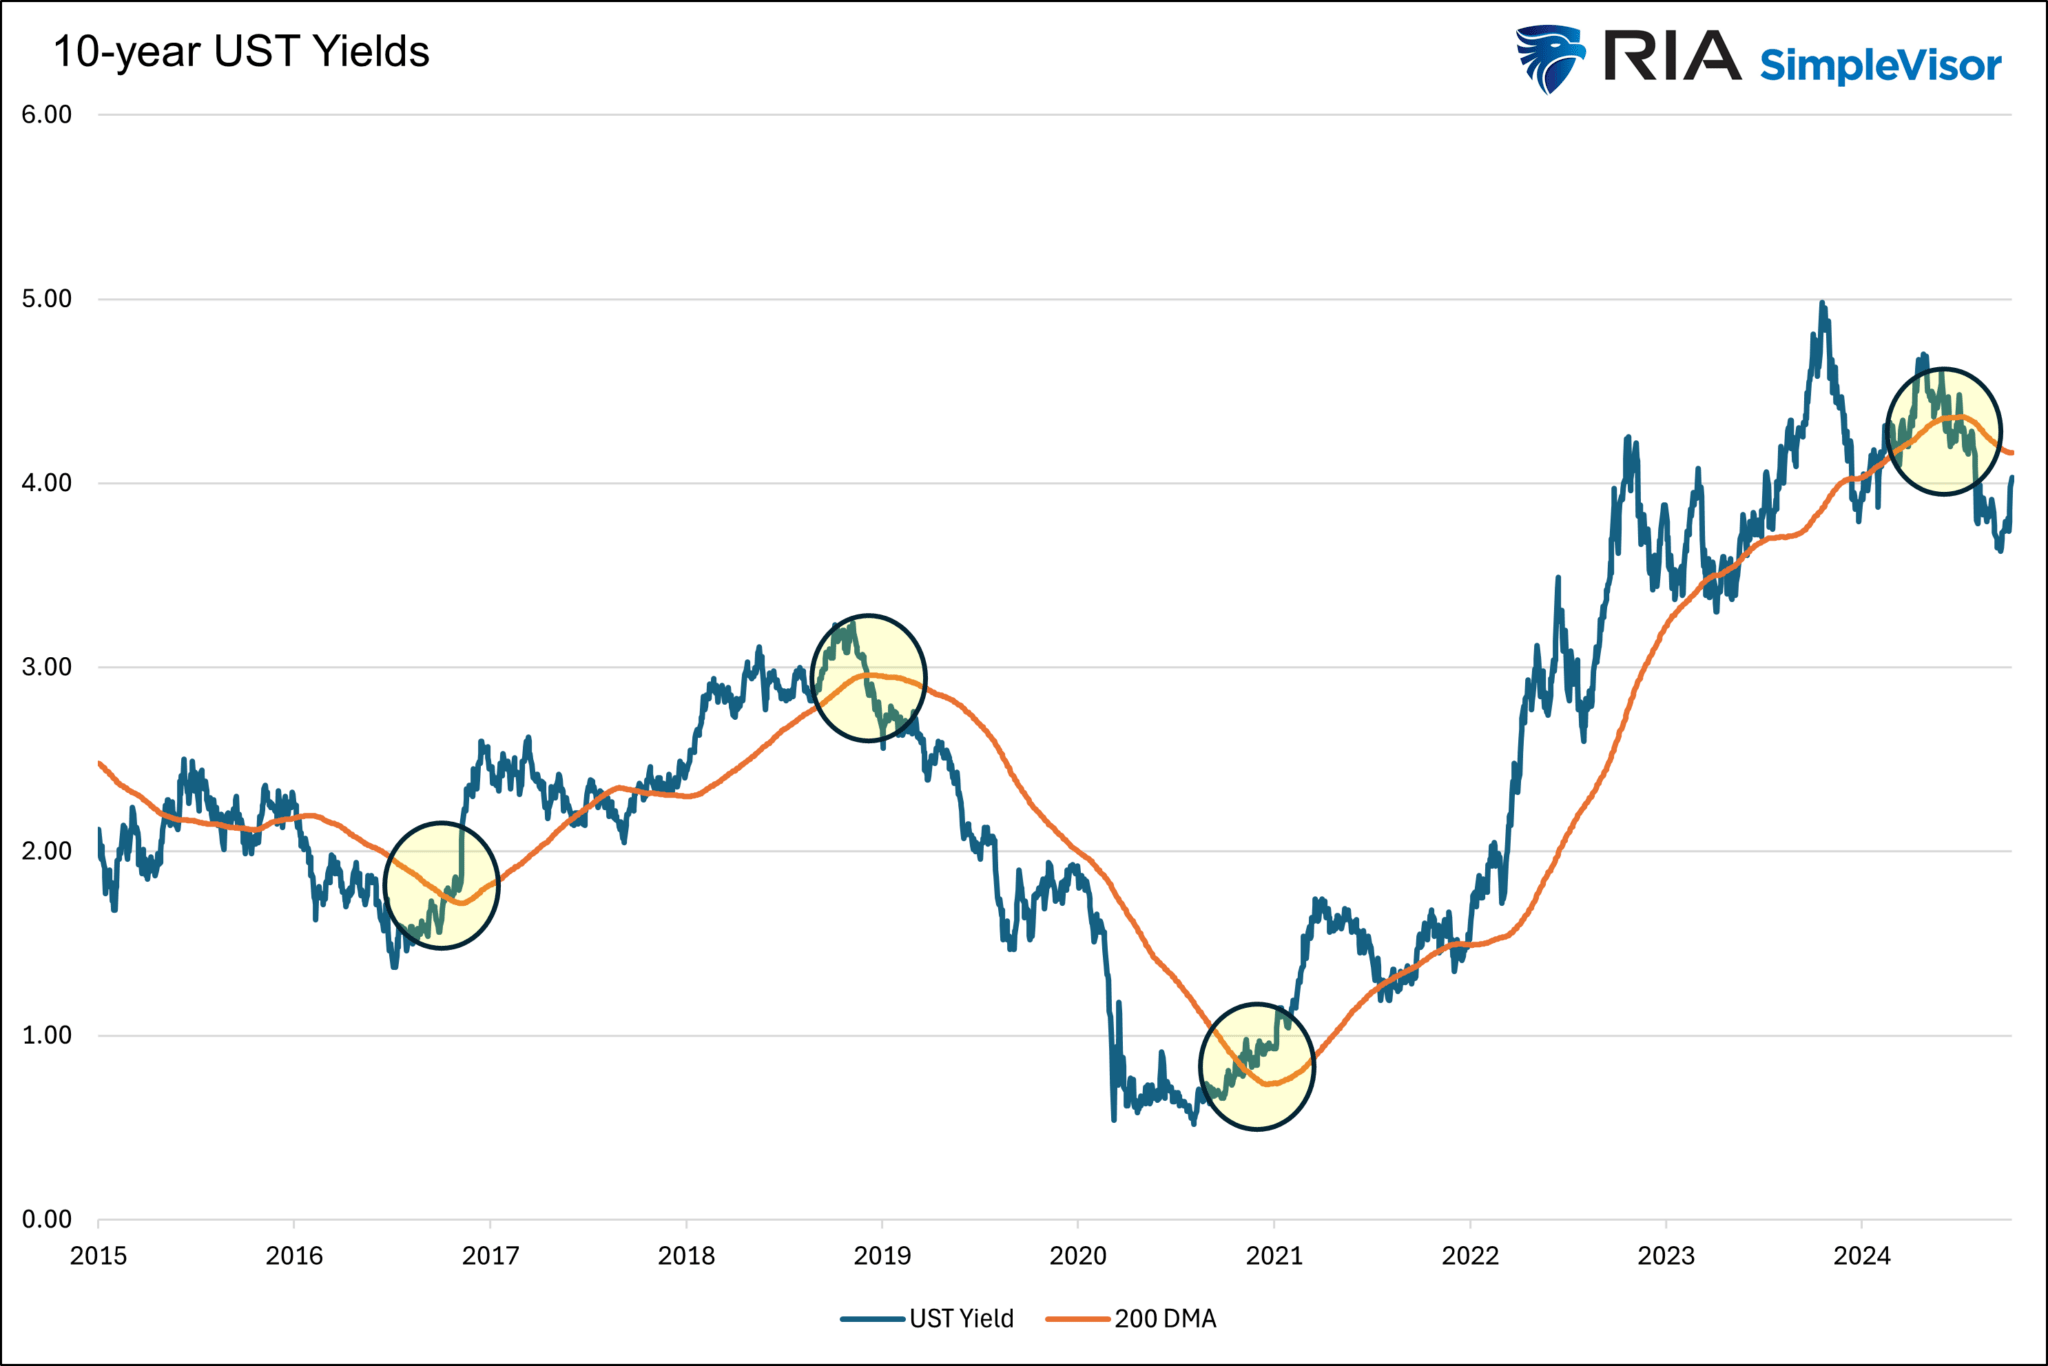
We graph the ten-year UST yield and its 200-day moving average below to appreciate better where yields might be going. The circles highlight how each significant change in the yield trend over the last ten years coincided with a breaking of the 200-day moving average. While new, the recent trend lower appears to have ample room to continue. But, recently, yields are heading up toward the 200-day moving average. If the yield nears the moving average, bounces off it, and proceeds lower, that is bullish, with lower yields likely. However, some caution is warranted. A sizeable break above the moving average may signal higher yields to come.
Bear in mind that the moving average is far from perfect. As we saw in 2017, the yield could decidedly break through the moving average for a brief period. Such a head fake is possible today if the inflation rate stops declining and the economy remains robust. In such a case, the Fed may stop its easing campaign, and yields could head upward.
We think the moving average should hold as inflation is not showing signs of heating up. The latest CPI report will tell us more today.
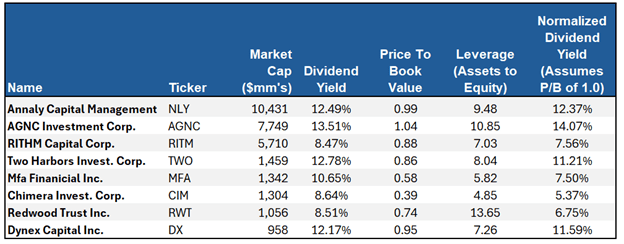
Analyzing Agency REITs
Numerous reader requests following our article, Agency REITs For A Bull Steepener, prompted us to write this follow-up with more detail about how to analyze agency REITs. This article doesn’t recommend specific agency REITs, but it does lay out some of the fundamental basics of the largest publicly traded agency REITs. In doing so, this analysis and the prior article provide a solid foundation for further evaluating agency REITs.
Tweet of the Day
“Want to achieve better long-term success in managing your portfolio? Here are our 15-trading rules for managing market risks.”