Written by: Rafael Zorabedian
As the S&P 500 marches on, the VIX is trading at pre-pandemic levels. Will the fear index remain subdued all Summer, or could a return of volatility be in the cards?
Last week seemed to be one of those weeks where the market could do no wrong . After digesting the previous week’s interest rate stance changes from the Fed, the S&P 500 just kept climbing and climbing last week, reaching all-time highs once again. Weak economic data print via Flash Services PMI? No problem; market higher. Unemployment Claims printing higher than expected? Also, no problem. Weak New Home Sales print? The market said no problem. The S&P 500 had plenty of upside to get last week, and it got it. What about this week?

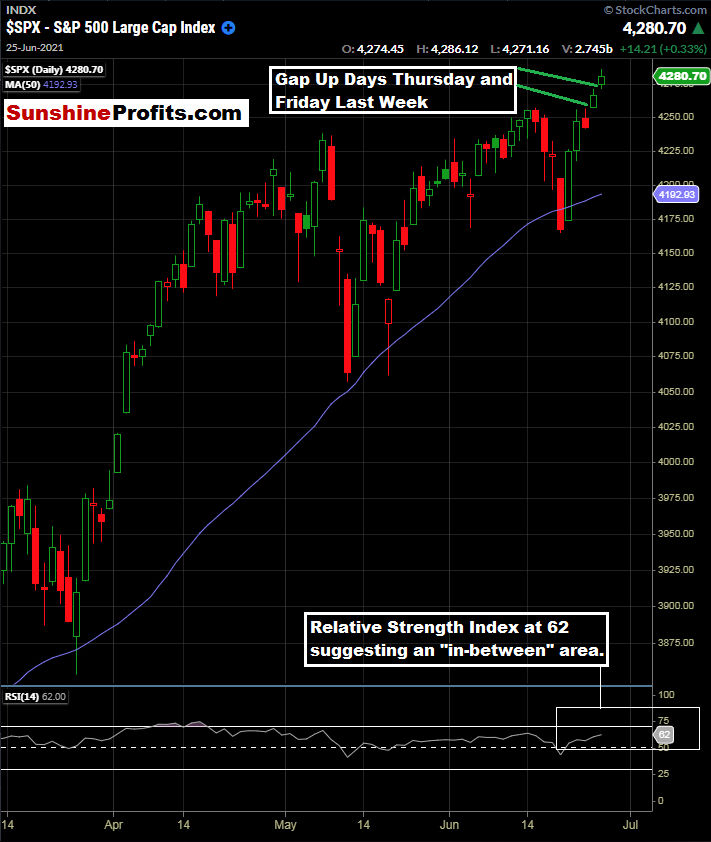
Figure 1 - S&P 500 Index March 13, 2021 - June 25, 2021, Daily Candles Source stockcharts.com
Towards the end of last week, we had two gap higher opens in a row; on Thursday and Friday. At the same time, we really do not have an extreme overbought condition via RSI(14), with the reading at 62. We closed at all-time highs on Thursday and Friday, and things have been looking rosy for the bulls.
So, while we were having these strong up days at the end of last week, I started watching the $VIX intraday, looking at not only the cash $VIX; but the front-month VX futures as well. I indeed noticed a solid bid under the market (especially in the VX front-month futures). While the volatility was still lower, there was indeed some bid to the market; you could just feel it and see it by watching. So, let’s take a look at the $VIX:

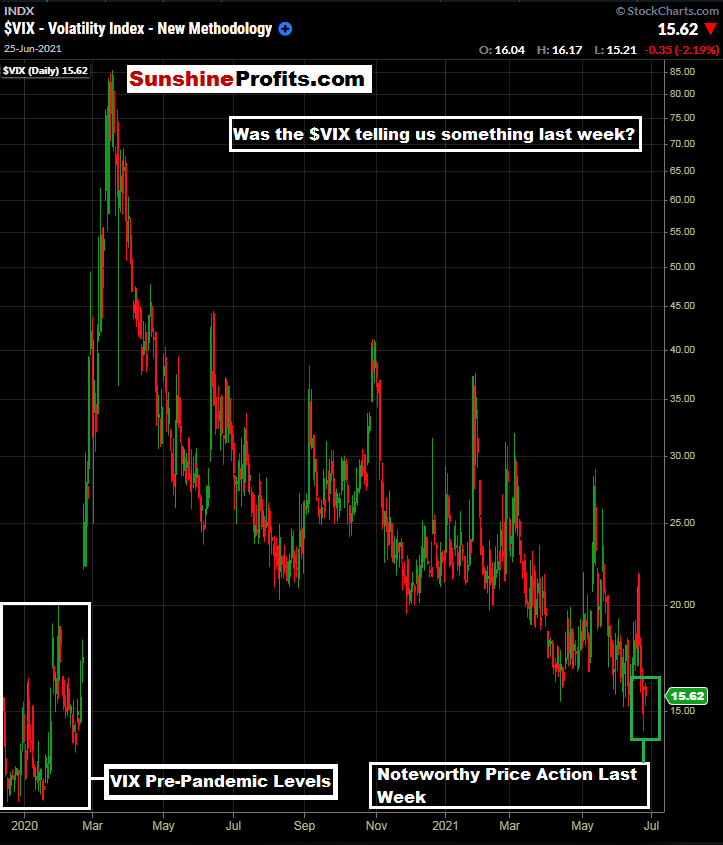
Figure 2 - $VIX Volatility Index December 9, 2019 - June 25, 2021, Daily Candles Source stockcharts.com
Above, we see the $VIX at its pre-pandemic levels and our current levels. What caught my eye last week (especially on Thursday and Friday) was the bid under the Volatility Index , even as the S&P 500 advanced higher and made all-time highs on gap-up days.
While the $SPX and $VIX do not have a 100% inverse correlation, they are certainly inversely correlated for the most part. Let’s take a more zoomed-in look at the daily price action late last week:

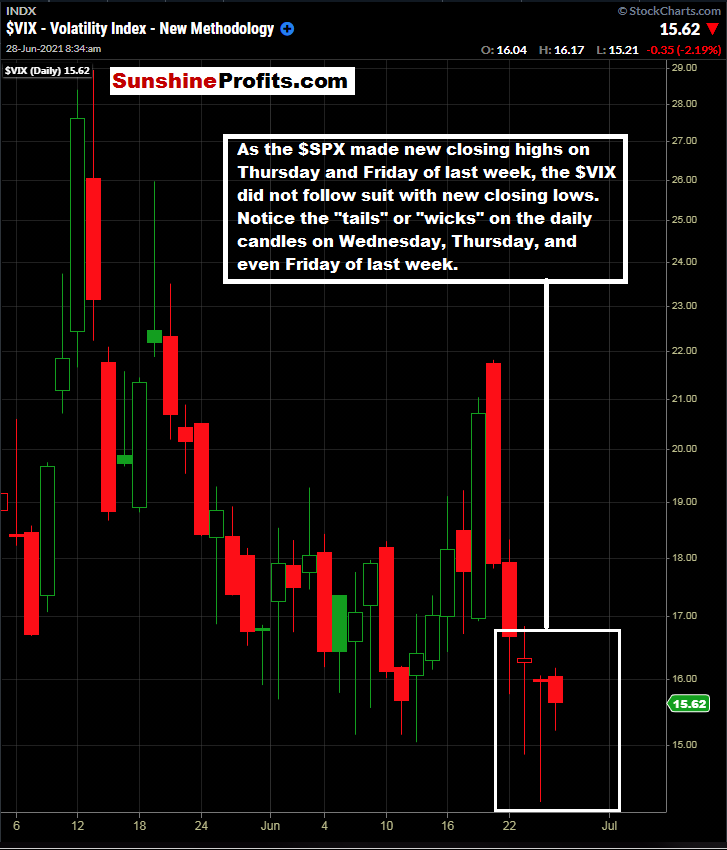
Figure 3 - $VIX Volatility Index May 5, 2021 - June 25, 2021, Daily Candles Source stockcharts.com
Divergences like we see here really capture my attention. Clearly, there was a bid under the Volatility Index last week, even as the $SPX was trading new highs.
It only makes sense. Money managers of all kinds are wise to use all-time highs to hedge portfolios by purchasing protection in the form of $VIX calls when volatility is low. Could this be a prelude to things to come over the Summer? What do you think?
It seems that we are at an “in-between” point of some sorts. While the $SPX is not flashing any extremely overbought technical warning signs, it has risen quickly from its 50-day moving average. Combining that fact with the price action in the $VIX last week, it all paints an inconclusive picture for me at the moment.
I think it is wise to be in tune with the state of the $SPX and $VIX ; and their relationship with one another.
This week, we have the big Non-Farm Payroll data on Friday, and the market will be waiting for that data. The above-described divergence could be a sign of overall sideways price action heading into the number on Friday.
Now, for our premium subscribers, let’s examine the nine markets that we are covering. At least one of them is primed for an exit today, so let’s dig right into it. Not a Premium subscriber yet? Go Premium and receive my Stock Trading Alerts that include the full analysis and key price levels.
Related: Fed Dot Plot Changes. US Equities Lower Post-FOMC Statement
The views and opinions expressed in this article are those of the contributor, and do not represent the views of IRIS Media Works and Advisorpedia. Readers should not consider statements made by the contributor as formal recommendations and should consult their financial advisor before making any investment decisions. To read our full disclosure, please click here.
