
Trending

Written By: Chris Vermeulen Our research team warned that the precious metals market would enter a 30~45 day rotational price trend on January 28, 2019. On January 16, 2019, we suggested that the upside price move in the US stock market had reached initial upside target zones and suggested that price pullback would be healthy near these levels. Today, we are warning that the markets are poised for a momentum breakout move that is setting up after the minor pullback in most US stock sectors the past week.There are a number of news factors which would both support our analysis of the precious metals market while resulting in a failure of our analysis of the US stock market. First, there is the opportunity for the US government to agree to and pass a funding bill that removes uncertainty for many months. If Congress is able to pass a longer-term funding bill that eliminates pricing pressures and fears in the markets, the US stock market could break out to the upside on a new momentum move very quickly. Second, if the US/China trade issues are resolved, in any substantial form, and trade begins to normalize over the next 6+ months, this could add even more fuel to the upside of the market and create a boost of momentum for almost all sectors.
The big question remains, which side of the fence will this news fall into and what will the likely outcome be in the US stock market?
We continue to believe a massive capital shift is taking place throughout the globe. Investors and traders are continually seeking safety and returns for their capital. Even the emerging markets present a unique opportunity right now, though not without a high degree of risk. We believe any news related to the US government funding and/or the US-China Trade issues will result in a new momentum rally in the US stock market potentially resulting in a 4~8% upside rally.Right now, unless some news solidifies regarding either of these potential news events, we believe a downside price rotation is still in the cards starting next week that could last 15~25 days. Should some news hit the wires that alleviates the uncertainty and concerns, then the downside expectations we have may be muted.Take a look at this daily NASDAQ chart with our Adaptive Fibonacci price modeling system. It is easy to see the Fibonacci projected target levels clustering near the $6700 level. It is also easy to see the upside (RED) projected level near $7000. Fibonacci theory teaches us that price is constantly seeking out new highs or new lows. Over the past few days, the price has settled into a range between $6840 and $7038. Given Fibonacci price theory rules, price MUST attempt either a new high or a new low outside this range.Our research suggests that a new price low is the highest probability outcome at this time (unless news hits to change the environment within the markets). Therefore, we still believe the downside price levels near $6700 are the immediate target levels for the NQ with an “exception” being the “Upside Breakout Zone”. This upside breakout/rally zone qualifies as the opposite condition to our expectations. If news breaks and the market does begin a momentum rally based on this news, then this upside zone will qualify for a Long Entry Zone with a potential for a very quick 2~5% upside potential.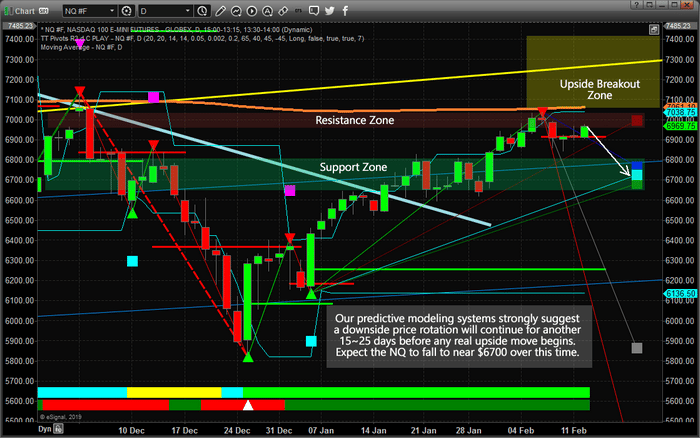 This Direxion Daily Technology Bull and Bear 3X TECL[ARCA] - $116.23 chart with our Fibonacci price modeling system suggests the same type of outcome. Barring any news events that change the investing environment, there is a strong potential for price to rotate lower towards the $99 level. Remember, price rotation is very healthy and essential. If we think about the primary rule of Fibonacci price theory, the price must always attempt to seek out new price highs or new price lows. So it makes sense that price will trend while creating rotational zones. Thus, a move to $99 would qualify as a new price low (breaking more recent low-price levels) and rotation back to the upside would qualify as a price direction change where new price highs will be attempted.
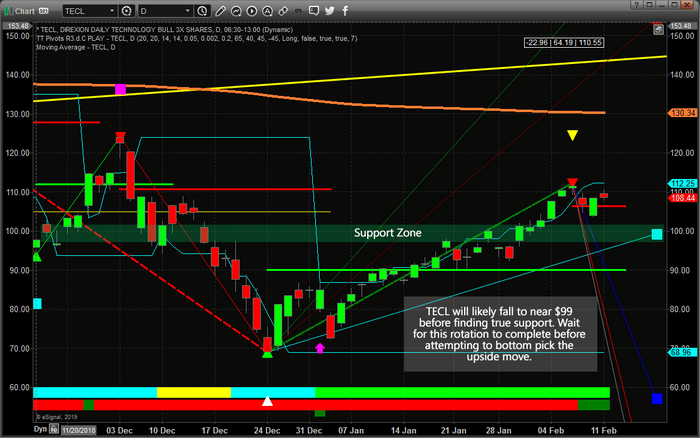 The one thing we have to remember as we are navigating this 15~25 day expected rotational price range is that external news events can have dramatic results in the markets. Our research team continues to scan news sources for sentiment and other market conditions. Gold fans are expecting prices to rally above $1320 very quickly. Most equity tradersare very concerned about the current price rotation in the US stock market and the massive range that has set up. Very few people have any real understanding of the future direction of these markets – everyone seems to be waiting for the next move.Related: MIT Says 2019 the Year That Blockchain Goes MainstreamWe believe 2019 and 2020 will be incredible years for skilled traders and we are executing at the highest level we can to assist our members' profit from our trades with us. In fact, we are about to launch our newest technology solution for our members that is unparalleled anywhere else.We've recently shown you what our predictive modeling systems believe is the likely outcome for the SP500 and NASDAQ over the next few months and we are waiting for the proper “setup” to reposition our members for the next move. If you want to join a group of professional traders, researchers and friends, then visit www.TheTechnicalTraders.com to learn how we can help you find and execute better trades. We recently closed GDXJ for a 10.5% profit, ROKU for 8.1%, and are currently up another 9% and 14.6% on two other positions. DISCLOSURE: We currently have a position in ROKU