Written by: Rafael Zorabedian
The June E Mini S&P 500 futures contract traded well early yesterday morning before the cash open. Cash traders, however, had different ideas when the opening bell rang in New York.
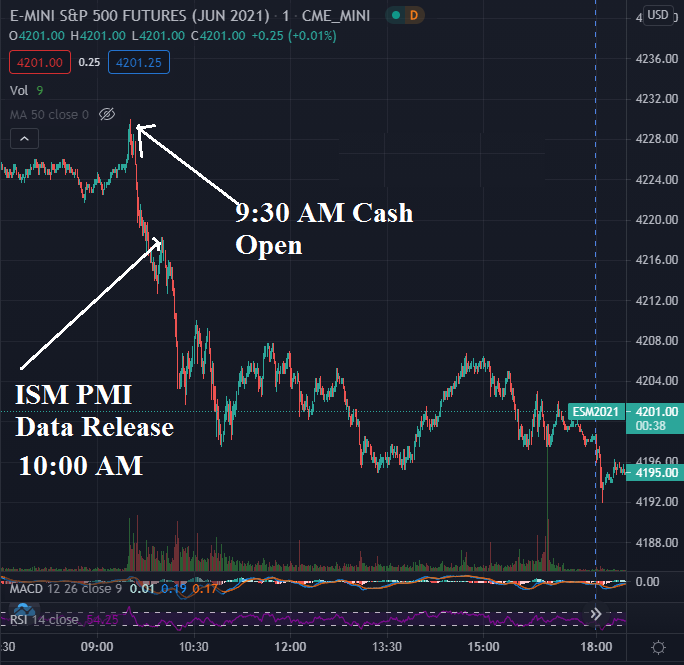
The June E mini S&P 500 (ESM2021) traded as high as 4230.00 right at 9:31 AM yesterday (June 1) as cash trading began. Traders were waiting on the PMI data release at 10:00 AM. Sellers came into the market right at the cash open, selling it down to 4213.00 in the minutes leading up to the data print. The data signaled inflation once again, with the PMI data printing 62.1, above market expectations of 61.5, and above the last measure of 61.5. Inflation became a concern here. Will the Fed eventually raise their overnight Fed Funds Rate? Will yields rise? This data print created uncertainty in the market, and the ESM2021 settled around 4199.75 at 4:15 PM ET yesterday.
This type of price action came as no surprise to me, as the prevailing macro theme of this week seems to revolve around Friday’s Non-Farm Payroll data. As mentioned yesterday, I view this type of trading week as “sideways trading in a wide range in the $SPX until the market gets a read on the NFP data.” Let’s see how this plays out heading into Friday.
The Cash $SPX settled almost flat, giving up 2.09 points (-0.05%) on the day. That’s what I would call sideways. The $VIX , however, tacked on 6.80%, furthering the potential of yesterday’s weekly outlook for volatility to get bid up this week, as the market waits for Friday’s jobs number. S&P 500 options implied volatilities got more expensive, with the uncertainty of Friday’s jobs number being a partial contributor.

Figure 1 - June Emini S&P 500 Futures 7:30 AM June 1, 2021 - 6:46 PM June 1, 2021 One-Minute Candles Source tradingview.com
A picture is worth a thousand words. In the above chart, we can see how the cash S&P 500 open was sold, and how the PMI print was sold.
However, with muted trading expected this week in a range, this doesn’t seem too surprising. The $SPX closed flat on the day, and the $VIX caught a bump. So, what would be the expected ranges for Wednesday’s and Thursday’s session?
We could actually consult the weekly options and determine the price range probabilities for the week, but that will include Friday trading data. Let’s just examine the recent ranges to get an idea for Wednesday and Thursday.

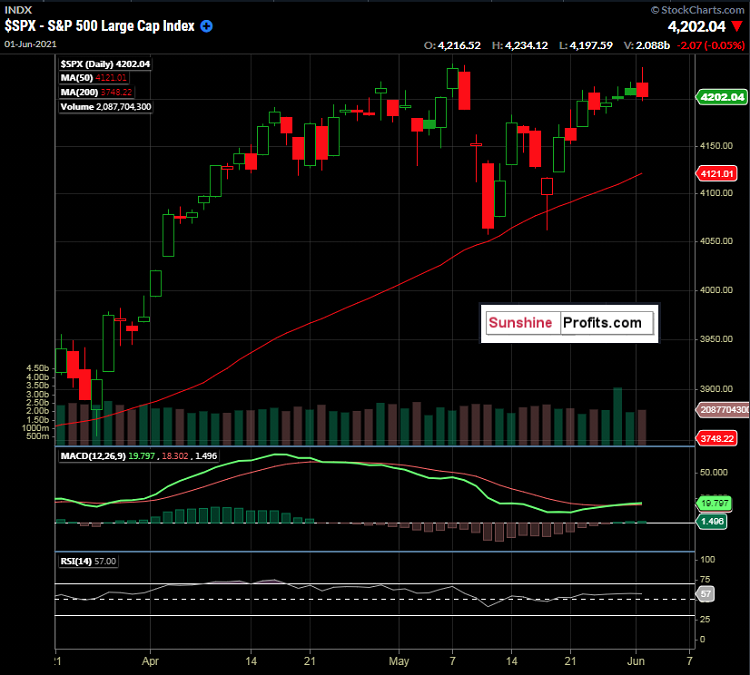
Figure 2 - S&P 500 Index $SPX March 25, 2021 - June 1, 2021, Daily Candles Source stockcharts.com
We can see that today’s high prints in the index (4234.12) at the US cash market open were getting close to the all-time high of 4238.04, set on May 7th. This level was denied and seems to lend some credibility to a rangebound market ahead of Friday’s NFP data.
The 50-day SMA sits at 4121.01 and this coincides well with the lows of the range towards the end of April, near 4118.00 - 4125.00. These figures could give us a range to look for over the next couple of days. Could volatility strike before the data? It could, however, I would expect it to be short-lived and mild. Nobody knows for sure, but let’s look for a rangebound $SPX on Wednesday and Thursday.

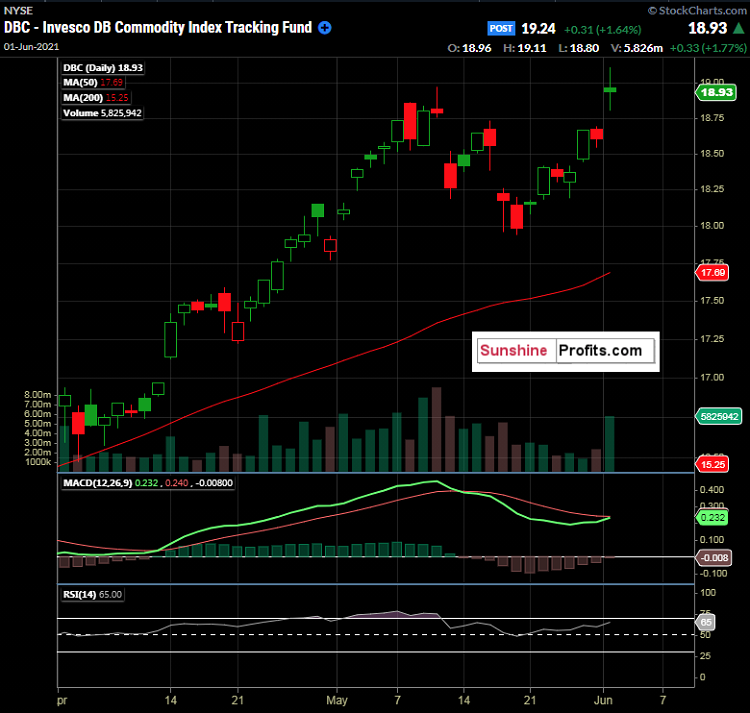
Figure 3 - Invesco DB Commodity Index Tracking Fund DBC April 1, 2021 - June 1, 2021, Daily Candles Source stockcharts.com
With inflation back in the spotlight yesterday, commodities rose overall, as can be seen in the above daily chart of DBC . In addition, there is news of the JBS Beef Plant Cyberattack that did not help with the inflationary theme. However, there is now news that the plans are coming back online.
The daily candle that was formed here could be an abandoned baby bear or exhaustion gap; note the gap up with the open and close levels almost identical. We will have to see how commodities trade tomorrow to see if this new high holds.
Now, for our premium subscribers, let's recap the markets and key levels that we are covering. Not a Premium subscriber yet? Go Premium and receive my Stock Trading Alerts that include the full analysis and key price levels.
Related: The Shifting US Economy: AI and Automation Lead the Way
The views and opinions expressed in this article are those of the contributor, and do not represent the views of IRIS Media Works and Advisorpedia. Readers should not consider statements made by the contributor as formal recommendations and should consult their financial advisor before making any investment decisions. To read our full disclosure, please click here.


