
Trending

At last week’s FOMC meeting, Jerome Powell clearly stated that recent signs of labor market weakness were an important factor in cutting rates. Therefore, assuming inflation continues to decline, the strength or weakness of the labor market will likely determine how much more they cut the Fed Funds rate. The well-followed BLS, ADP, Jobless Claims, and JOLTs labor market data are essential to the Fed’s decision-making. Outside of those reports, there is a slew of other data that, while not as prominent, can provide more timely clues about the labor market. Today, we present two such lesser-followed labor market indicators.
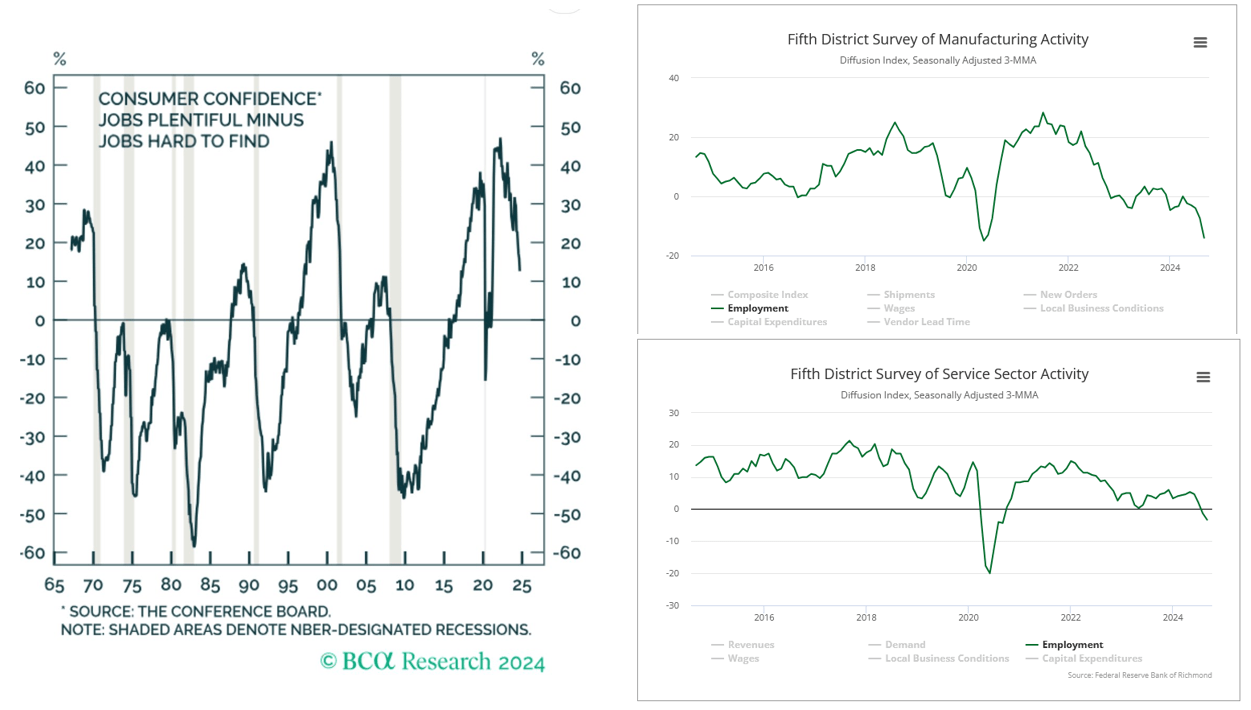
The graph on the left comes from Tuesday’s Consumer Confidence report. According to the Conference Board, it measures “the percentage of respondents who say jobs ‘are plentiful’ compared to the percentage of respondents who say jobs ‘are hard to get.’” As shown, the index has peaked months before each recession and rebounds shortly after it is over. Furthermore, the index tends to either be increasing or decreasing. It rarely stays static. Post 1990, the recessions coincided with a ratio of zero or below. The ratio is declining and approaching zero.
The graphs on the right are from Tuesday’s Richmond Fed manufacturing and service sector surveys. Both show that employment in the district is weakening. Manufacturing conditions are now on par with the worst of the pandemic. The service sector is not as bad but below zero, connotating a labor force contraction. This is just one of many regional Fed surveys with similar sentiments regarding employment.
A recession is not imminent, but a growing amount of labor data points to weakness. Next week’s three employment reports and the national ISM surveys will either confirm the charts below or present a more optimistic view.
What To Watch
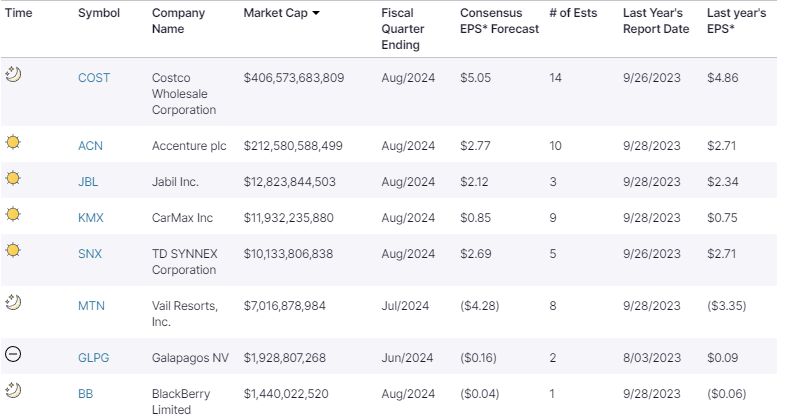
Earnings
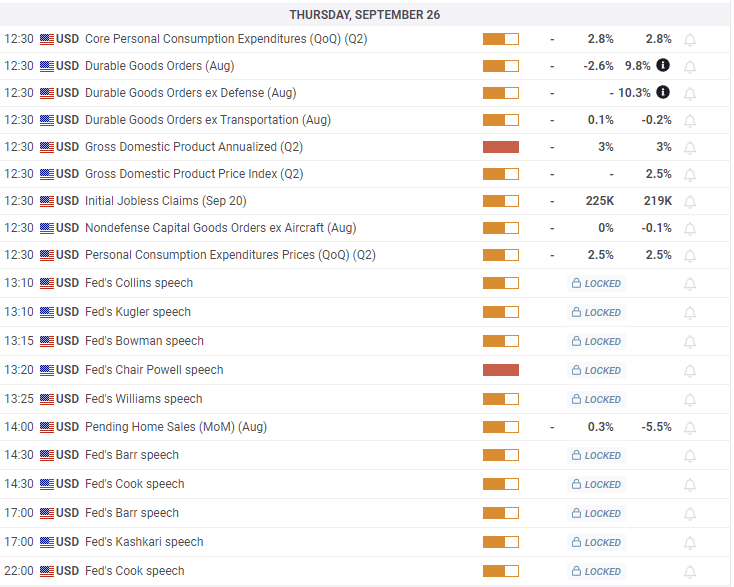
Economy
Market Trading Update
Yesterday, we touched on Wall Street’s rush to upgrade year-end price targets based on hopefully increasing economic growth rates. With markets breaking out to all-time highs, the rush to allocate to equities has been quite bullish. Technically, as discussed in yesterday’s Before The Bell video, the market has formed a “Cup and Handle” formation. This is historically a very bullish pattern that leads to higher highs. As discussed in that video, the breakout of that bullish formation technically supports Wall Street’s price target of 6000-6300 by year-end. Using the recent August lows to break above the July highs suggests a Fibonacci extension to 5986.

Of course, such a rally might not occur for plenty of reasons. The upcoming election, earnings season, and a continued weakening in consumer confidence and economic data remain. However, as is always the case, the markets can and often do, remain illogical longer than you can remain solvent.
We continue to remain equity-biased as bullish sentiment exists. However, we suggest paying attention to risk heading into November and looking for a better entry point for a potential year-end rally.
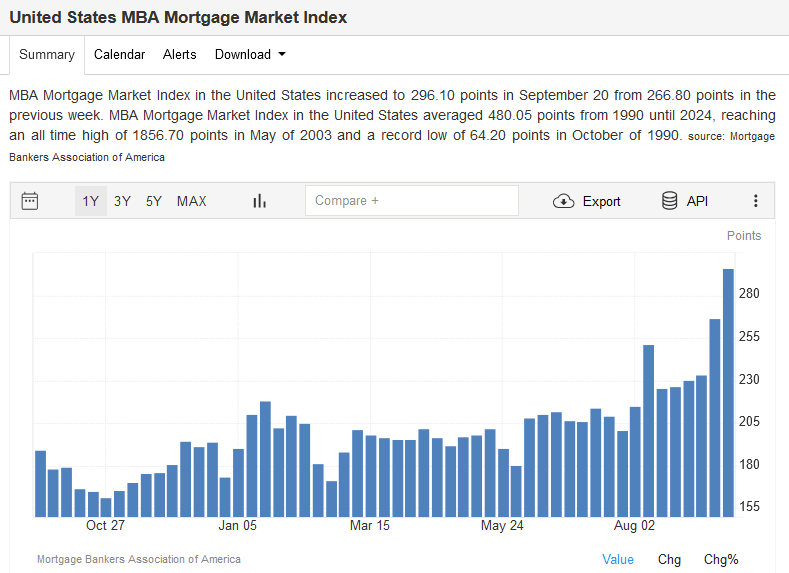
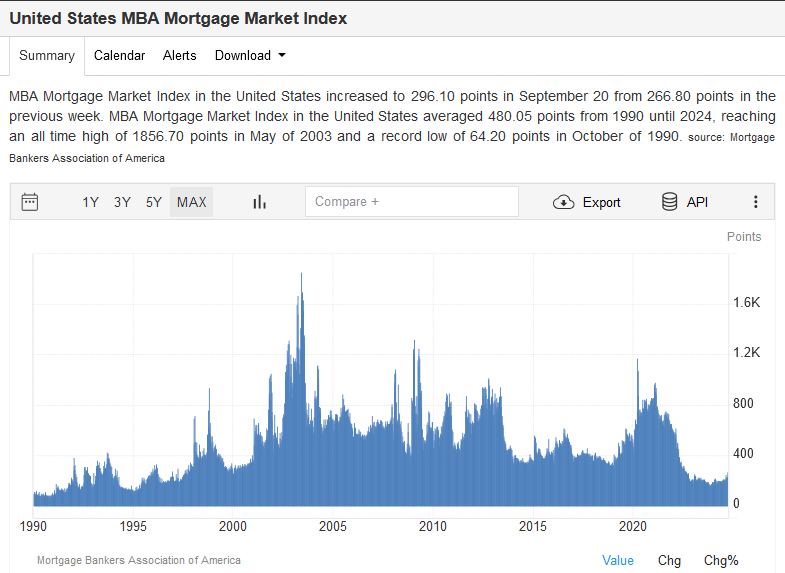
MBA Mortgage Index Is Surging, Sort Of
The MBA mortgage index rose to its highest level since July 2022 as mortgage rates fell to 6.13%. The index measures both home buying applications and refinancings. The first graph shows the MBA mortgage index surging, which is welcome news for the stagnating residential real estate market. However, the second graph puts the first graph in proper context. Despite being at a two-year, it is still at the lowest level in over 20 years.
The index should continue to rise, assuming mortgage rates keep declining. However, because so many current homeowners have very low-rate mortgages, the benefits of lower mortgage rates will be slower to take hold than the market is used to. It may take mortgage rates of 5% or even lower to see the index rise above the pre-pandemic peak.
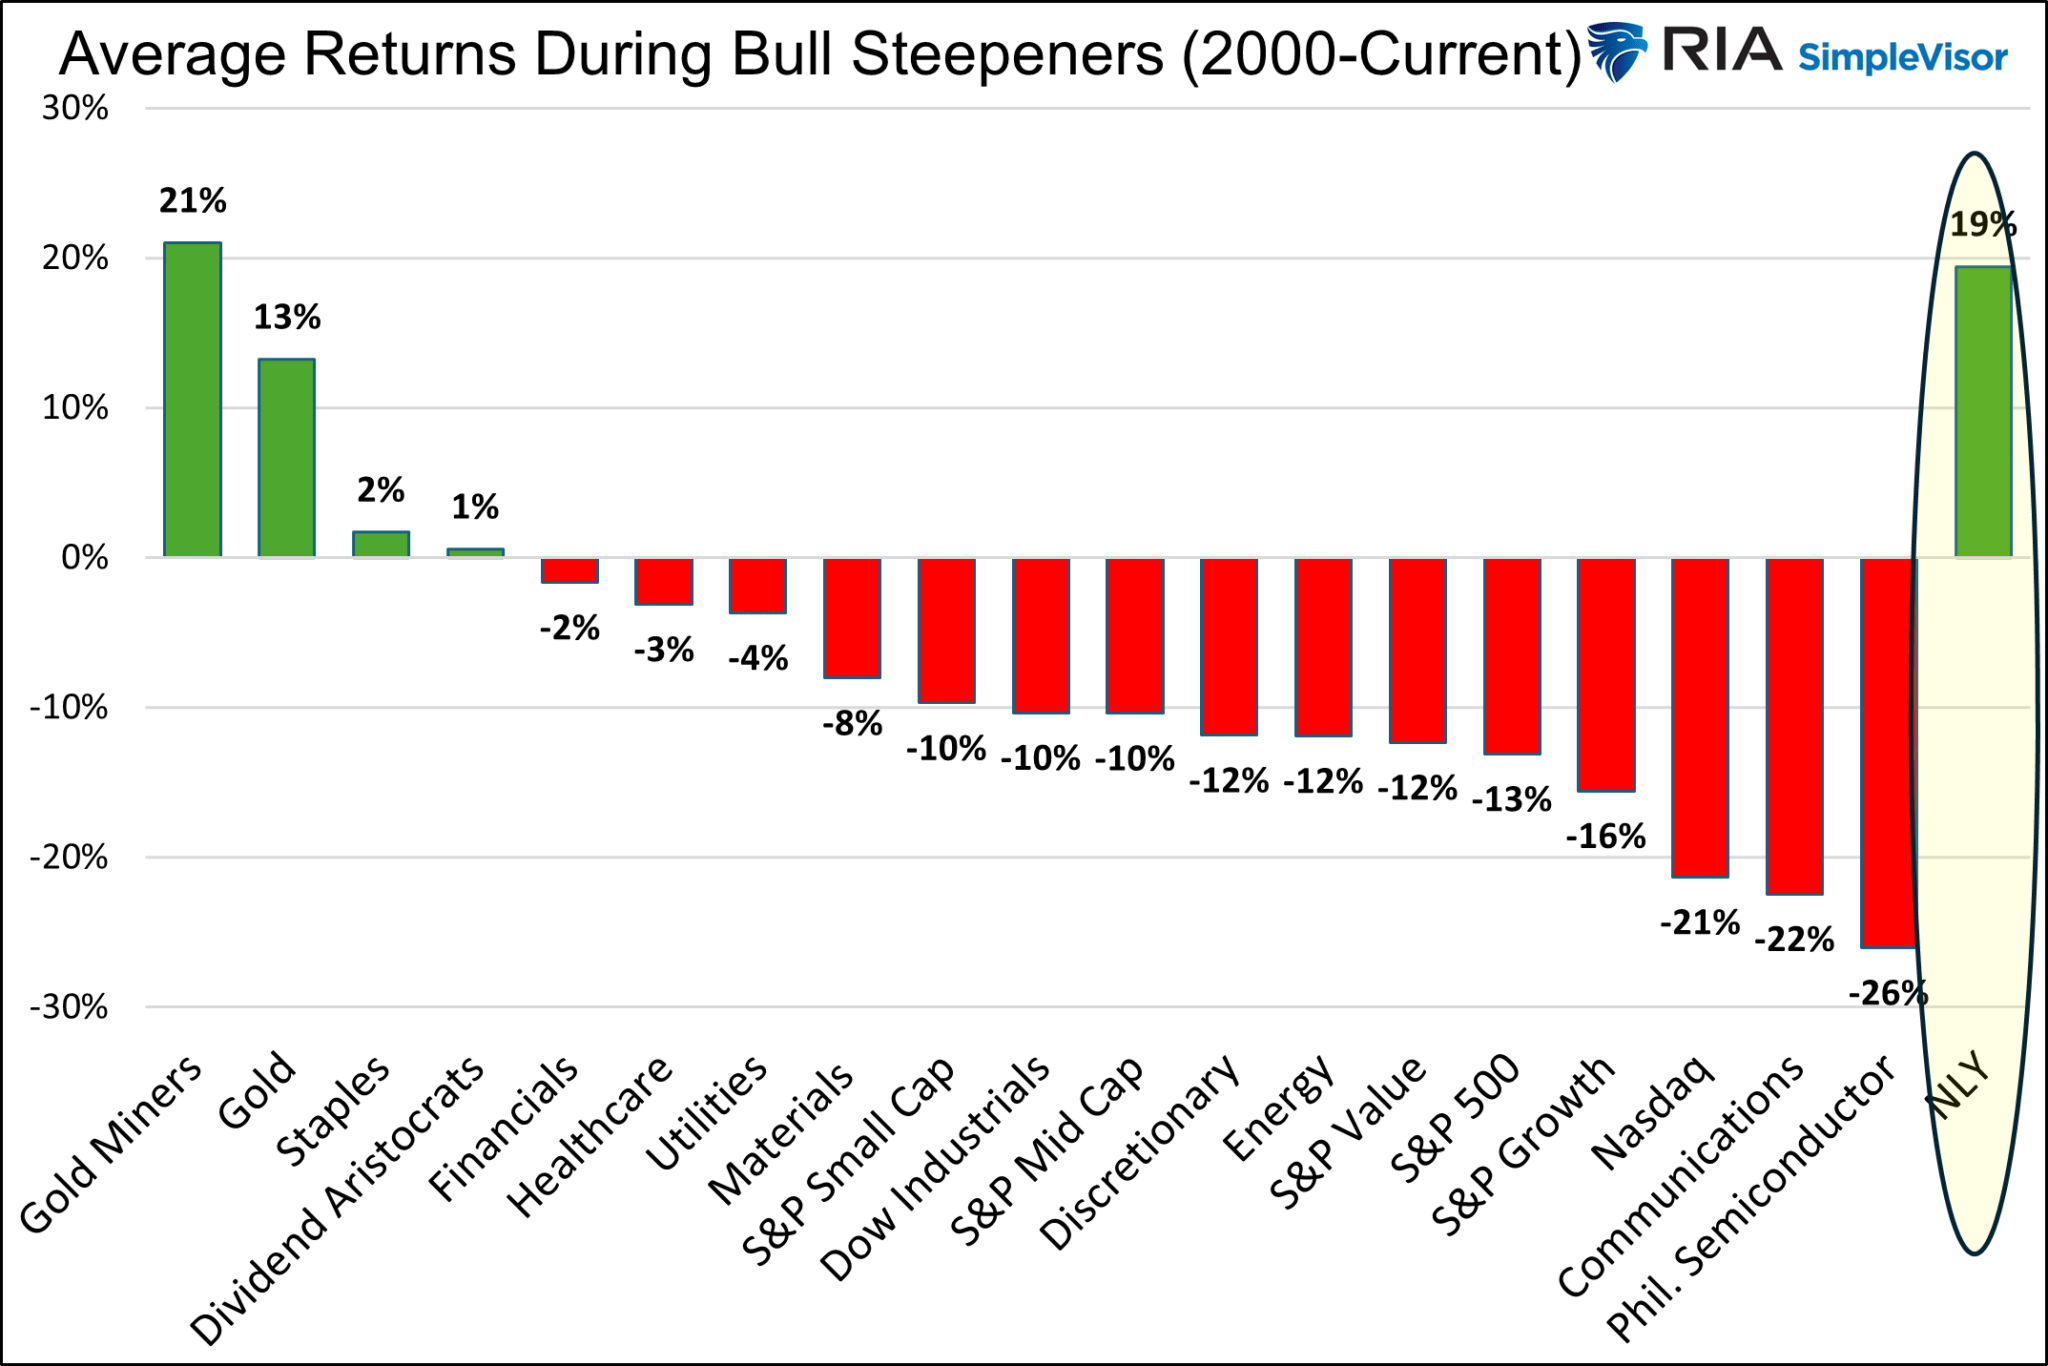
Agency REITs For A Bull Steepener
Like banks, most agency REITs borrow for shorter terms than the duration of their assets. Creating such a mismatch in a positively sloped yield curve can result in additional profits as borrowing costs are less than asset yields.
If the bull steepener yield curve trend continues, agency REIT MBS should gain value. However, the duration of the MBS will shrink due to prepayments. New MBS replacements will have lower yields. However, funding costs should decline. There are many moving parts to consider. While the environment is conducive for profits, as we noted earlier, the performance of agency REITs comes down to hedging acumen.
Tweet of the Day
“Want to achieve better long-term success in managing your portfolio? Here are our 15-trading rules for managing market risks.”
Related: Will the Fed Ignite a New Wave of Inflation? Here’s What They Say