
Trending

Seasonality has long influenced stock market trends, offering insights into predictable cycles of strength and weakness throughout the year. Yale Hirsch, the creator of the Stock Trader’s Almanac, is one of the most well-known contributors to studying these patterns. His research has highlighted that certain periods of the year consistently present better opportunities for investors to generate returns, while other times warrant caution.
The adage ”Sell May and Go Away “ is a common topic of discussion that many investors are familiar with. The historical analysis supports that the market tends to be the weakest of the year during the summer months. Hirsch’s Stock Trader’s Almanac introduced the idea that the stock market follows a seasonal rhythm, where certain times of the year offer greater return potential. This work has helped investors identify key windows where market performance historically improves, allowing them to align their strategies accordingly.
- “Sell in May and Go Away”: One of the most famous adages in market seasonality, this concept reflects the tendency for stocks to underperform during the summer months, roughly from May through October. Investors are often advised to exit or reduce exposure during this time to avoid potential downside risk.
- The Best Six Months: Conversely, the period from November through April has been historically stronger for stocks, with higher average returns. This seasonal trend is based on data showing that a significant portion of stock market gains often occur during this half of the year.
The Math
The chart below shows that $10,000 invested in the market from November to April has significantly outperformed the amount invested from May through October.

Interestingly, the max drawdowns are significantly larger during the “Sell In May” periods. Previous important dates of major market declines occurred in October 1929, 1987, and 2008.
However, not every summer works out poorly. Historically, there have been many periods when “Sell In May” did not work, and markets rose. 2020 and 2021 were examples of massive Federal Reserve interventions that pushed prices higher in April and subsequent summer months. However, 2022 was the opposite, as April declined sharply as the Fed began an aggressive interest rate hiking campaign the preceding month.
Technical analysis, however, can improve outcomes.
The Role of the MACD in Seasonal Investing
While the seasonal trends provide a useful framework, Hirsch’s research goes further by applying technical indicators like the MACD to refine entry and exit points. The seasonal MACD (Moving Average Convergence Divergence) signal, in particular, serves as a trigger that confirms when it’s the right time to re-enter the market after the weaker summer period.
The MACD is a momentum-based indicator that measures the relationship between two moving averages of a security’s price—typically the 12-day and 26-day exponential moving averages (EMAs). When the shorter-term EMA crosses above the longer-term EMA, it generates a buy signal, indicating the potential start of an uptrend. In seasonal investing, this technical indicator is combined with Hirsch’s seasonal trends to offer more precision in market timing.
- Seasonal MACD Buy Signal: This signal typically triggers near the end of October or early November, aligning with the start of the “Best Six Months” period. It confirms that market momentum is shifting upward and is a favorable time to re-enter the market.
- Seasonal MACD Sell Signal: Similarly, at the end of the “Best Six Months” (usually in late April or early May), the MACD sell signal indicates weakening momentum, suggesting it may be time to reduce equity exposure.
On Friday, October 11, 2024, the S&P 500 index triggered its seasonal MACD buy signal, marking the beginning of what has historically been a seasonally strong period for the stock market. This signal arrives just before November, reinforcing Hirsch’s findings that the months ahead tend to deliver better returns.

3-Market Supports For Seasonality
In 2024, three primary drivers will likely support markets from the middle of October through year-end and likely into early 2025.
Earnings
The first is earnings season, which has proved normal so far, although this week and next will be very important in corporate outlooks. As discussed in the latest BullBearReport, analysts significantly lowered the “earnings bar” heading into the reporting season. As noted in “Trojan Horses,” analysts are always wrong, and by a large degree.
“This is why we call it ‘Millennial Earnings Season.’ Wall Street continuously lowers estimates as the reporting period approaches so ‘everyone gets a trophy.’”
The chart below shows the changes for the Q3 earnings period from when analysts provided their first estimates in March 2023. Analysts have slashed estimates over the last 30 days, dropping estimates by roughly $3.40/share, but nearly $18 lower than their initial estimate.
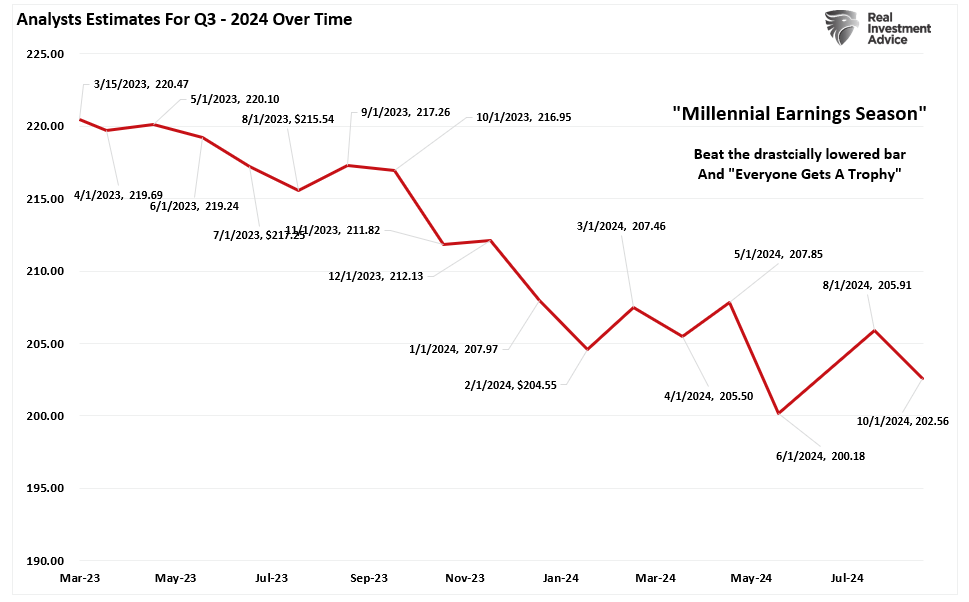
Of course, lowering the bar will generate a high “beat rate” by companies, which will help fuel stock prices in the short term.
Performance Chasing
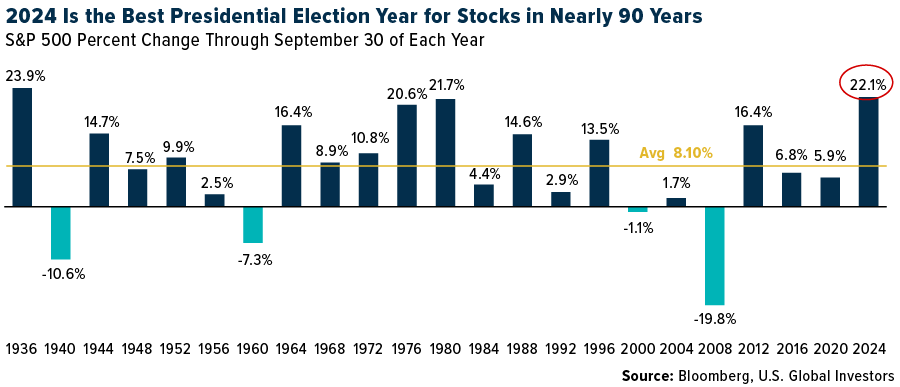
Secondly, according to Morningstar, during the first half of 2024, only 18.2% of actively managed mutual and exchange-traded funds outperformed the cap-weighted S&P 500 index. There are several reasons for this, including the lack of allocation to the “Magnificent 7,” dispersion in returns of holdings, and lack of allocation to non-traditional assets.
This underperformance occurs during the best presidential election year in roughly 90 years, which will pressure fund managers to play “catch up” with performance moving into year-end reporting. Given the “career risk” to managers of significant underperformance, additional buying pressure could manifest.
Corporate Share Buybacks
Lastly, corporate share buyback windows will reopen in November and December as companies exit their earnings “blackout period.” Notably, the last two months of the year represent the best two-month period for corporate executions as companies rush to complete buybacks for the current tax year. With nearly $1 Trillion in authorizations for 2024, the pace of buybacks will be exceptionally strong this year.
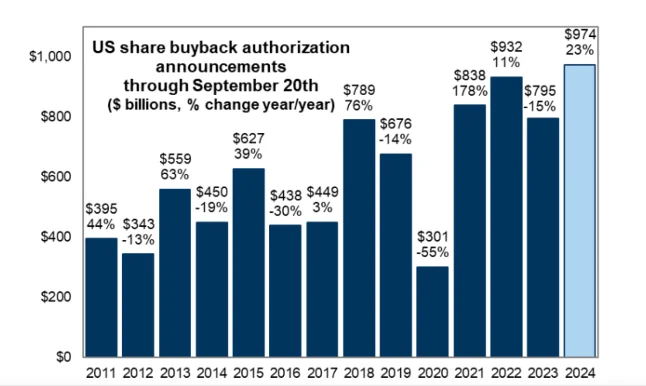
As noted by Goldman Sachs:
“The VWAP machines will be lining up to buy $6bn worth of equities daily during November and December.”
Yes, that is $6 billion each trading day, which provides sufficient buying power to lift asset prices into year-end.
Seasonality: Not A Risk-Free Adventure
For investors, this seasonality signal could be an opportunity to increase exposure to equities, particularly in large-cap stocks that tend to drive the broader market. However, it’s essential to recognize that while the MACD signal aligns with historical trends, it does not guarantee future performance.
Despite the historical reliability of seasonality and the MACD buy signal, investors must still be aware of risks.
- Monetary Policy: Inflation, interest rates, and global economic uncertainty could weigh on stock performance, even during a seasonally strong period. Given the recent bout of strong data, if the Federal Reserve slows the pace of rate cuts, this could disappoint markets. A good example is 2018, where the Federal Reserve’s more hawkish stance preceded a 20% correction in November and December.
- Geopolitical Risks: Ongoing geopolitical tensions, whether in Eastern Europe, the Middle East, or relations between major economic powers, can quickly disrupt financial markets. Unexpected events, such as escalating conflicts or trade wars, could derail the seasonal trends.
- Market Volatility: Volatility can spike unexpectedly, leading to sharp market corrections. Even during strong periods like the “Best Six Months,” short-term market corrections are always possible. Investors should be prepared for heightened volatility, especially if other risk factors, like earnings surprises or economic data, create uncertainty.
- Historical Trends Are Not Guarantees: Past performance, while instructive, does not guarantee future results. Although the MACD buy signal has been a reliable indicator in the past, external factors could reduce its predictive power. Investors must be cautious and not rely solely on seasonality and technical signals.
Most crucially, the technical backdrop also poses near-term risks. The market has been up six weeks in a row, which historically is a very long stretch without a correction.
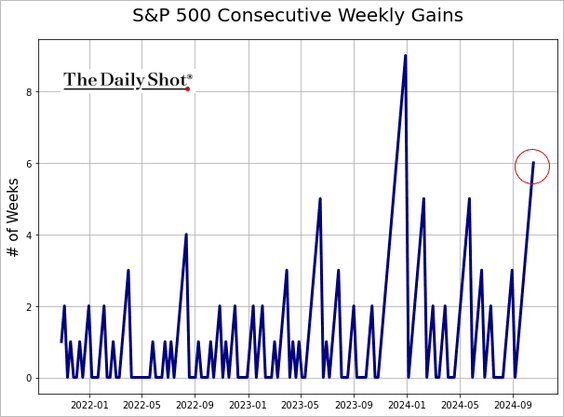
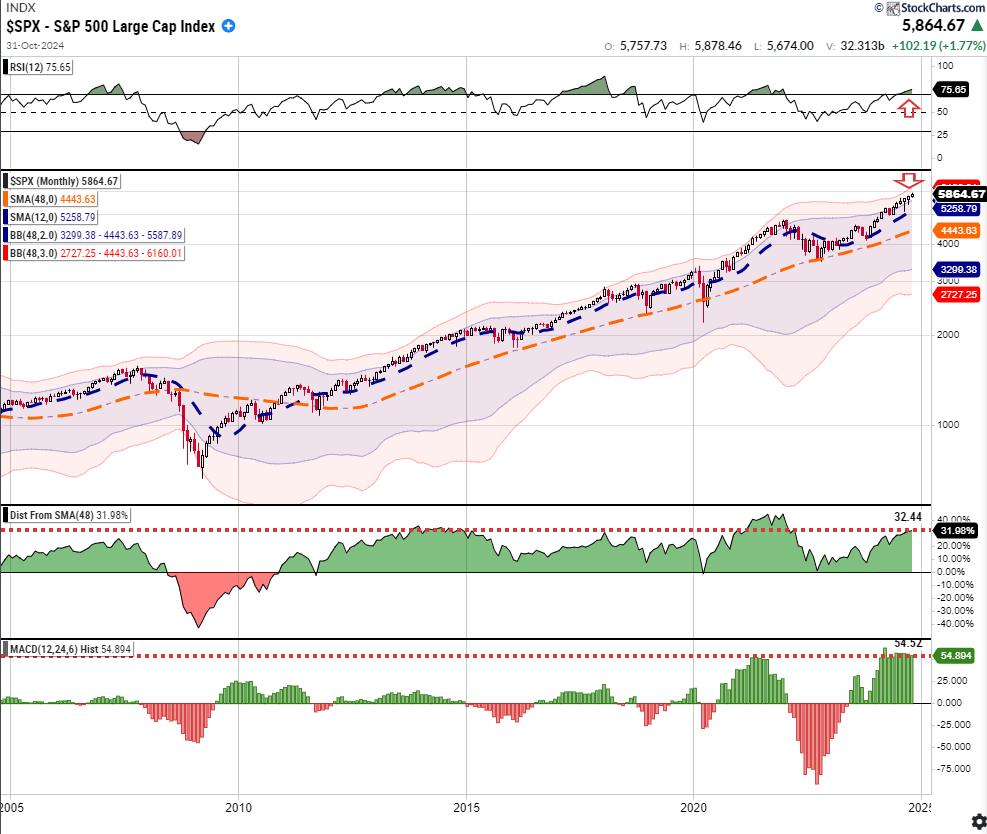
From a purely technical view, with the markets deviating well above MONTHLY moving averages and overbought, a correction or consolidation is becoming increasingly likely before the year-end advance can take shape.
Navigating Into Year-End
With the S&P 500 now in a seasonally strong period, bolstered by the weekly MACD buy signal, investors may want to consider several strategies:
- Increase Equity Exposure: Large-cap stocks historically perform well during this period. You could consider increasing exposure to diversified index funds or sector ETFs that align with historical trends.
- Review Portfolio Risk: While the MACD buy signal is a positive indicator, you should assess your portfolio’s risk tolerance and ensure it aligns with your long-term goals.
- Rebalance Allocations: Now may be a good time to rebalance by reducing positions in riskier assets or diversifying across asset classes.
- Use Stop-Loss Orders: To manage downside risk, consider using stop-loss orders.
Yale Hirsch’s research on market seasonality, paired with the power of the MACD signal, offers a disciplined approach to navigating historical market trends. The recent MACD buy signal for the S&P 500 provides investors with a potentially advantageous entry point into the market as we head into the historically strong “Best Six Months” period. However, it’s crucial to remain aware of the risks, including macroeconomic headwinds and market volatility.
Trade accordingly.
Related: Bastiat and the Broken Window Theory: Understanding Opportunity Cost