Written by: Bryce Coward | Knowledge Leaders Capital
Last week we were privy to both new inflation and initial unemployment claims data. The CPI data revealed a rather mundane inflation scenario. Meanwhile, the weekly initial claims number came in at a whopping 853K and missed estimates by the largest amount since June. Yet, even as these data seem to jive on the surface – prices muted while unemployment claims rise – other higher frequency data are painting a different picture: inflation up and claims up.
Indeed, CPI as calculated by the Bureau of Labor Statistics is full of adjustments and other processes that make it somewhat less useful as an inflation measure than other data series. We’ll leave that topic for another day. Suffice it to say that inflation expectations as measured by both the bond market and other survey data are painting a not so mundane picture of inflation. Meanwhile, there is less variability in the data when it comes to employment, which appears to be weakening markedly across many metrics.
As the reader can see in the first chart below, core CPI rose only 0.2% MoM and is up just 1.6% YoY (i.e. not strong). In contrast, both 2-year breakeven inflation expectations as priced by the Treasury bond market (an excellent real time measure of inflation) and ISM manufacturing prices are rising strongly and are at multi-year highs.


The problem as I see it is not so much that inflation data seem to be gaining steam (outside of the CPI!). Rather, it’s that the employment situation is weakening at the same time. Economists have a word for this: stagflation.
As the reader may observe in the next chart, inflation expectations are rising at the same time initial unemployment claims also seem to be turning higher.

Another way to see this phenomenon is through ISM manufacturing prices and employment data. I use the ISM manufacturing survey as opposed to the ISM services survey as manufacturing data tend to be more sensitive to changes in underlying trends. The ISM survey has prices at a 2-year high and coming in at a strong 65 (readings over 50 represent expansion) while employment dipped back into contraction at 48.

What’s more, the initial claims data has been leading the ISM employment series by one month all year long. That initial claims have turned higher again does not portend great things for manufacturing employment in the month ahead.

Now, we may yet see inflation data reverse course here as Lockdown 2.0 heats up and the weather cools. But, that is not the message from the bond market’s real time inflation expectations. Indeed, despite the weak CPI reading and weak claims data, 2-year inflation expectations have risen from 1.62% to 1.77% in the last week, which is a strong rise for a 5-day period. In any event, it appears the probability of some form of stagflation is rising.
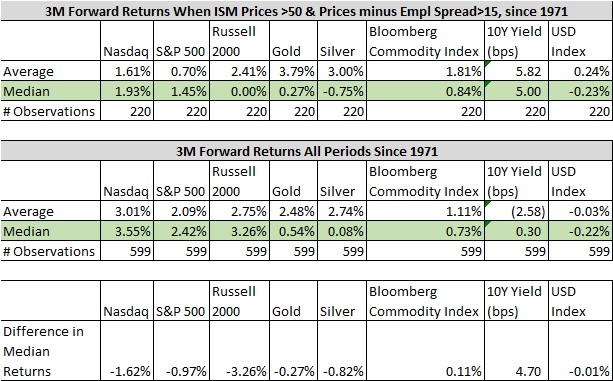
Now the question becomes what to do about it? For that we delve into some simple stats. When we analyze forward 3 month returns in periods when the ISM prices index is greater than 50 AND the spread between ISM prices and ISM employment is greater than 15 (i.e. much stronger inflation than employment), we get the below. In all 599 monthly periods since 1971, about one third of them meet our simple criteria for stagflation. Based on the median forward return when this setup prevails, every single asset class in our analysis underperforms the median all-period return, except broad-based commodities.
Importantly, the underperformance is most pronounced among equities and bond yields also tend to rise. This means the muted equity returns in the stagflation environment are not compensated for by lower rates. Only broad-based commodities outperform in the stagflation environment, and even then the outperformance compared to all periods is rather placid.
We’d view these results as a modest negative input for risk assets heading into the winter months. When combined with “crazy speculative” activity in the options market, excess risk taking at this juncture may not yield the desired result.

Related: The Election Has Crushed Volatility


