
Trending

After a manic week down in stocks and bonds, last week was the opposite. And, whether it is the old “recency effect” kicking in, or not, my message is this: calm down.
The shifts in investor sentiment have been a whipsaw. Maybe this is the start of a generational opportunity to “buy the bottom” in long-term bonds. Or, maybe it is just Lucy pulling the football away from Charlie Brown again as he’s about to kick it. Let’s see what a quick set of charts does to help us understand the story the market is trying to tell us. I’ll summarize it all at the bottom of this post.
TLT: a good start, but not so fast
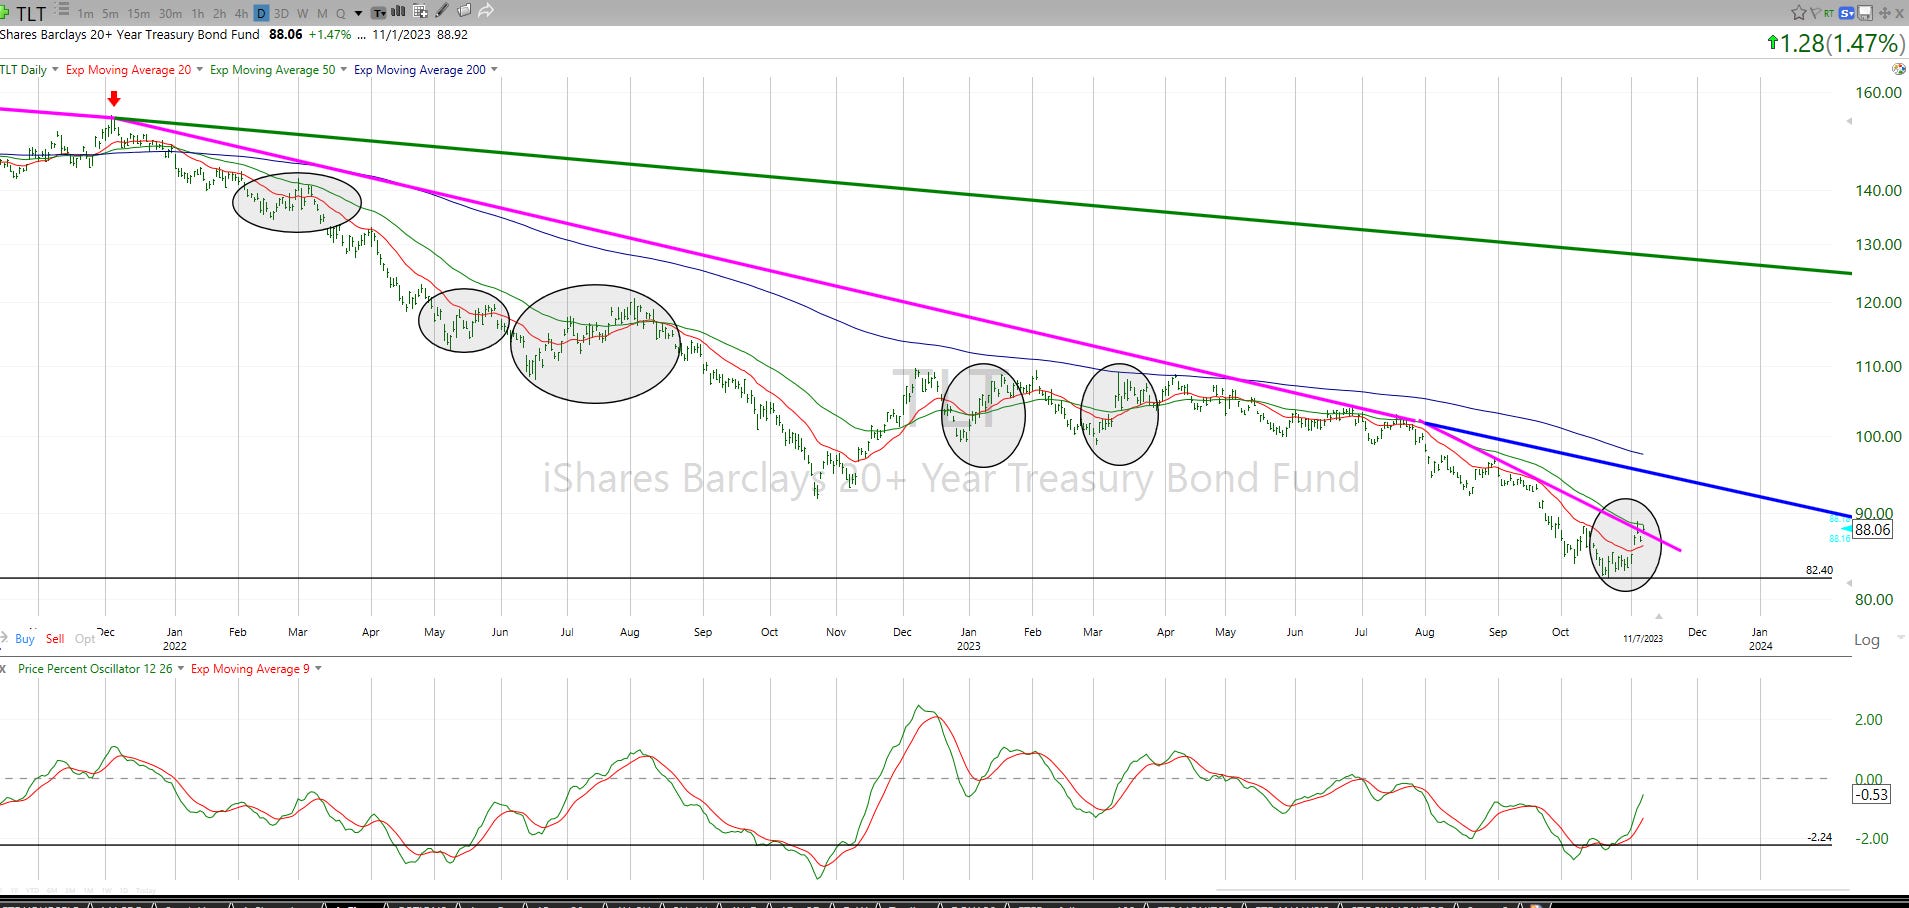
First, here is the chart of what’s driving a lot of the sudden sense of urgency for some investors. TLT is an ETF that tracks 20-30 US Treasuries, which tend to be more volatile than shorter-term bonds. And is that ever an understatement lately!
|
|
(all charts courtesy of TC2000)
See the colored lines I’ve drawn above. Here’s what they tell me:
-
Pink line: downtrend in place since late 2021, and in August of this year, its rate of decline increased. That dropped the price of TLT by more than 15% in just 3 months. Remember, this is a bond fund! That brought TLT to a loss of about 46% from its peak 3 years ago.
-
The near-term market reaction has been “buy the bottom in long-term bonds.” As we say here, anything can go up in price at any time. It is just a matter of how much risk of major loss you’re taking to pursue that return. I still think investors are underestimating the potential for TLT to get worse before it eventually gets much better. That’s the same thing as saying that long-term Treasury rates could still go back to and above 5%.
-
To me, TLT quickly jumping through the pink downtrend line is encouraging, but not “game over” for bond bears. The blue line is a more important target, since anything short of that is a “bear market bounce.” And way above the blue line is the green line, which would be about a 40% rally in TLT from here. The last time TLT traded up where it would likely hit the green line ($125) was in April of 2022, when the 10-year bond rate was 2.4%.
-
Conclusion: the recent rally in TLT and its peers is a good start. But I still see it as a high-reward/high-risk situation. This is where, for those tempted to jump in, portfolio position size is so important.
QQQ: are we back to this again?
|
|
-
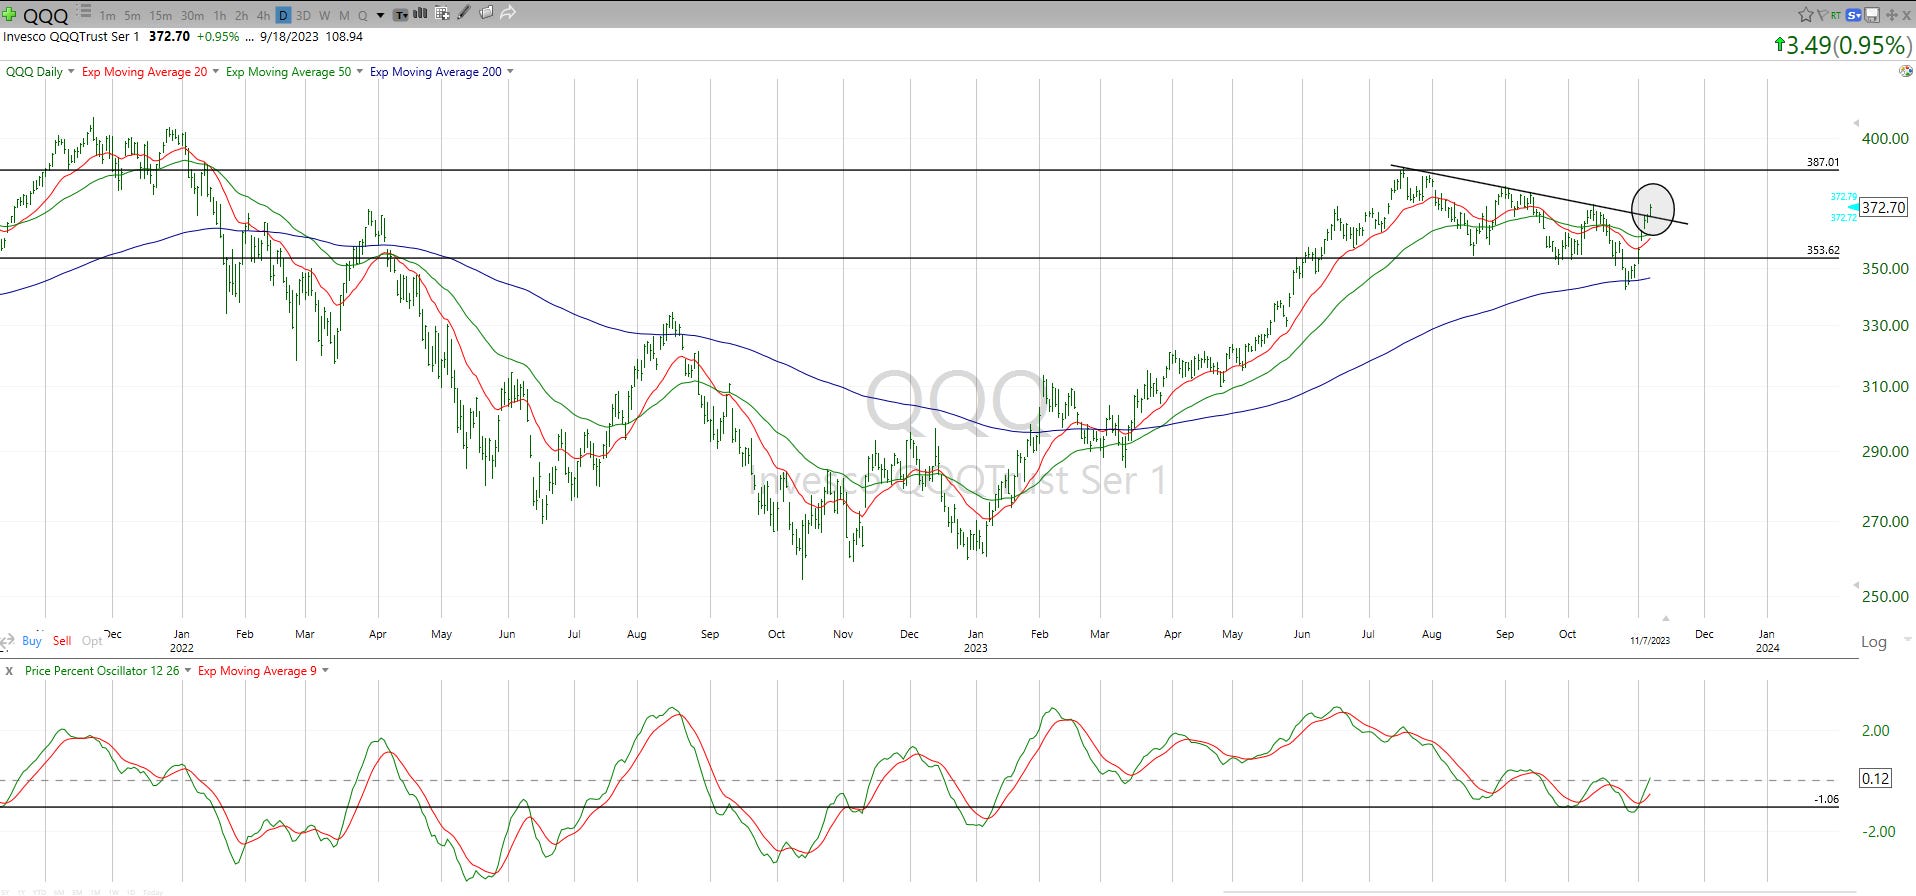
For much of this year, QQQ, the Nasdaq 100 Index ETF, was the only thing in the global stock market showing up. The returns of the top 7 or 8 stocks were so big, it masked the very low positive or negative returns of most of the market during 2023. QQQ dipped by about 11% from July until last week, when it burst out of the gate like a thoroughbred.
-
And while the S&P 500 looks like it is having a tepid, tenuous bear market rally, still within the trading range I’ve shown you here a couple of times, QQQ just peaked its head above its recent downtrend line. So, perhaps there’s another 4% rally in store until it regains the full amount of that recent drop.
-
Even if that happens, my question is, then what? With so many laggard effects on the economy from the Fed’s 11 rate hikes just starting to hit the economy and employment levels, can the stock market just keep blowing it off? No crystal balls here, but the stronger the “Naz” and its small number of giant stocks carries the load, the more it starts to look like the “safe haven” asset, the only place where stock returns can be had.
-
I’m not on board with that yet, but I do know that this is the time of year where professional money managers may feel pressure to play catch up. Or “chase” the part of the market they didn’t own when the QQQ was soaring earlier this year. Let’s see what happens here. It will impact the rest of the stock market into year end.
Final thoughts for now
-
The longer this period of investing malaise goes on, the more favorably I look at bonds versus stocks: not as an all-or-nothing proposition, and not with TLT as the core holding. There are many other areas of the bond market as well as parts of the equity market that we can access through ETFs, to provide as straight a path toward generating total return as modern markets allow.
-
This truly has been a year of head-shaking for just about every investor I know, professional or otherwise. I’m glad to have spent it surrounded by a ton of T-bills, with a mix of attempted tactical trades around that portfolio anchor.
-
At some point, I look forward to having more than a modest amount of market exposure. But the key is this: just because the price of something is way down, that doesn’t mean it is “cheap.” Think of it this way in basic math:
-
If you start with $100 and lose 1/3 of it, you have about $67. How many times can you lose 1/3 of what is left? The answer is infinite. This is the lesson of past bear markets, where investors en masse tried to “pick the bottom.”
-
Look back up at that TLT chart. See those 5 circles? Those are just some of the supposed bottoms that some investors tried to pick as a timing exercise, with way too much of their portfolio. And the more one tries and gets disappointed playing that game, the more they want to “get it all back.”
Related: Why Target Date Funds Fail Investors: A $3 Trillion Delusion