Written by: Abhishek Ashok, M.A., MFE, CFA® | AGF

Source: AGF Investments using data from Bloomberg LP. Rolling six-month performance spread between MSCI U.S. Growth Index and MSCI U.S. Value Index. Full data set of research calculated from January 1, 1975 to July 31, 2023. Past performance is not indicative of future results, one cannot invest directly in an Index.
It’s no wonder that one of the big stories in equity markets this year has been the outperformance of growth stocks (i.e. shares in companies that are expected to grow their earnings more than average) over value stocks (i.e. shares in companies that are trading at a price less than their intrinsic value).
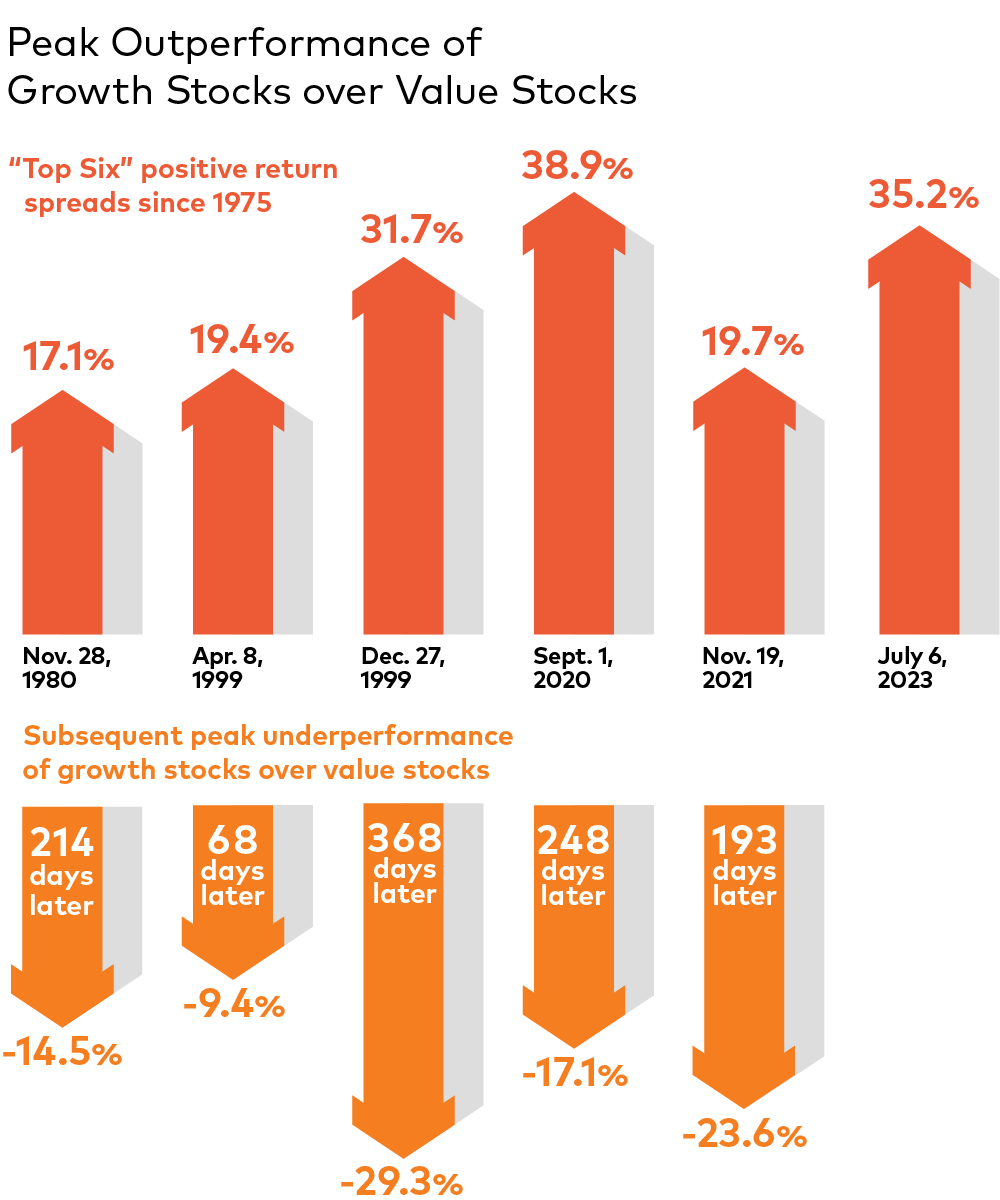
Indeed, there has only been one other period in the past 50 years that the performance spread between the MSCI U.S. Growth Index and MSCI U.S. Value Index reached as large a margin as it did in early July, when it stood at 35.2% (see graphic above).
But what’s perhaps even more interesting about this dynamic is how quickly the outperformance of growth stocks can dissipate after it hits a peak. For instance, it took less than a year for them to go from outperforming value stocks by almost 40% in the late summer of 2020 to underperforming value stocks by 17% the following spring. And, in 1999, it took just over two months for them to go from outperforming value stocks by 19% to underperforming by almost 10%.
Granted, there’s no guarantee that reversals are set to happen again. After all, the performance of growth and value stocks – like any investment – is largely determined by events and circumstances taking place now or in the future, rather than by repeating what has occurred in the past.
But as Mark Twain reputedly said, “history may not repeat itself, but it often rhymes,” and should growth stocks lose more of their lustre relative to value stocks going forward, investors should hardly be surprised.
Related: Stagflation Is Not the Danger, It’s Crushing Long-Term Growth


