
Trending

Written by: Rafael Zorabedian
Equities traded quietly higher in Thursday's NY session. Simultaneously, bonds were bid rather firmly, sending interest rates even lower. What is going on beneath the surface?
Greetings. I hope this article finds you and yours well. Today, we are taking a look at some additional market indicators and internals to get an unbiased perspective on things.
First, I want to preface things by mentioning that I am not suggesting that I am fully bearish on the S&P 500 or stocks right now. However, I am taking more of a cautious stance at the moment.
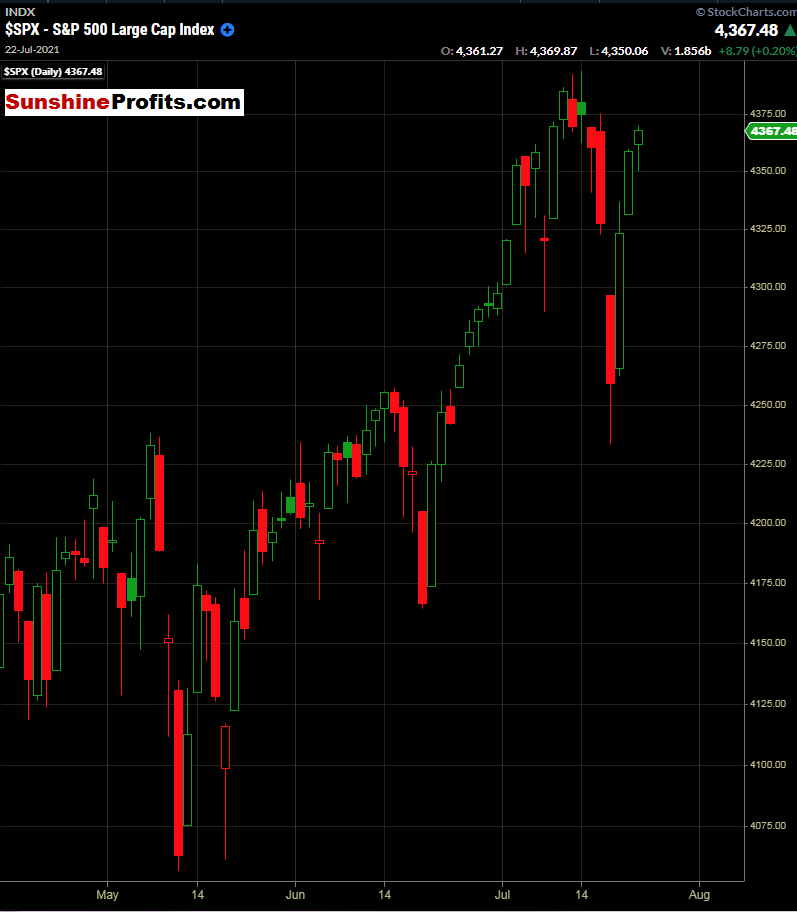
Figure 1 - S&P 500 Index April 15, 2021 - July 21, 2021, Daily Candles Source stockcharts.com
Nothing new to see here. Just another pedestrian pullback to the 50-day SMA and a bounce back. This pattern has repeated itself several times since the pandemic lows in the $SPX. It won't repeat itself forever - that would be too easy.
Since it is earnings season, let’s talk earnings multiples.
Feeling bullish? It can be challenging to get excited about an $SPX at 4400 with an estimated 46.40 P/E ratio (trailing twelve months). We are in the middle of earnings season, so we will have a clearer figure soon.
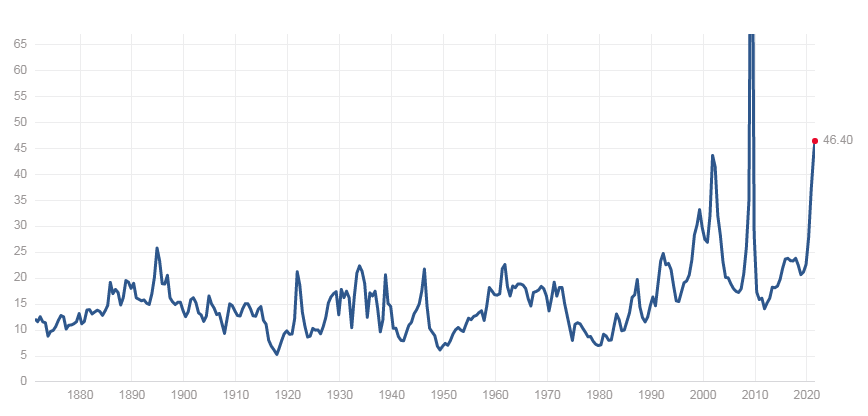
Figure 2 - S&P 500 PE Ratio 1870 - July 22, 2021. Source multpl.com
Stocks are not cheap by any measure, folks. However, with easy monetary policy and low rates, this is to be expected. What could be the catalyst to derail this freight train?
How about the Dow Transports? This index used to be talked about much more frequently and is followed closely by students of Dow Theory. We just don’t hear much analysis about it on Fox Business, CNBC, or Bloomberg these days.
The Dow Transports (Dow Jones Transportation Average) $TRAN is an index comprised of 20 companies.
Here are the index components and weighting as of December 2020:
Alaska Air Group, Inc. 2.55%
American Airlines Group Inc. 0.76%
Avis Budget Group, Inc. 1.80%
C.H. Robinson Worldwide, Inc. 4.61%
CSX Corporation 4.39%
Delta Air Lines, Inc. 1.94%
Expeditors International of Washington, Inc. 4.61%
FedEx Corporation 13.10%
J.B. Hunt Transport Services, Inc. 6.70%
JetBlue Airways Corporation 0.70%
Kansas City Southern 9.73%
Kirby Corporation 2.51%
Landstar System, Inc. 6.60%
Matson, Inc. 2.79%
Norfolk Southern Corporation 11.42%
Ryder System, Inc. 3.12%
Southwest Airlines Co. 2.26%
Union Pacific Corporation 9.91%
United Airlines Holdings, Inc. 2.11%
United Parcel Service, Inc. 8.39%
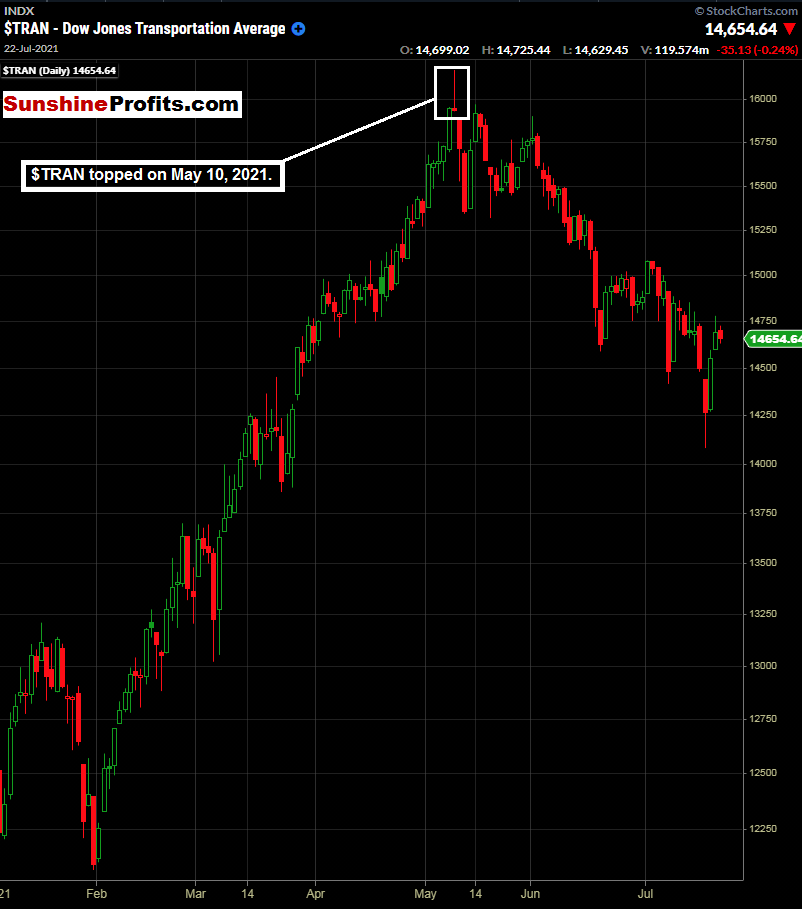
Figure 3- Dow Jones Transportation Index January 4, 2021 - July 21, 2021, Daily Candles Source stockcharts.com
Here, and in contrast to the Dow Jones Industrial Average, we can see that the Transports topped back on May 10, 2021. Proponents of Dow Theory would argue that this creates a lack of confirmation and that the subsequent highs in the Dow Jones Industrial Average are not valid due to this lack of confirmation.
What could be the reason for the stall in the Transports? Input Costs? While fuel costs have risen, what about the rise in retail spending? Is the stimulus-powered consumer pocket not enough to counterbalance the rising input costs?
If input costs are the reason for the stalling, what about the other companies that rely on raw materials to make their products? Recent inflationary data has not affected these companies' stock prices yet (for the most part).
What if the Fed eases off the gas pedal?
While it is very difficult (if not impossible) to pick market tops (and I don't advocate trying to do that), it is wise to look at certain market indicators to get an understanding of what is going on beneath the surface.
It is easy to look at the chart of the $SPX and see that it is moving higher, from the bottom left-hand corner of the chart to the top right-hand corner. However, that does not tell the whole story of what is happening in the US equity markets.
We will be monitoring the above and previously mentioned market internals and indicators for more clues in the coming days, weeks, and months. I think it is critical to be aware of metrics such as the above as the broader indices trade near all-time highs.
Related: Inflation Nation: Pressure Builds, Underwater Beach Ball
The views and opinions expressed in this article are those of the contributor, and do not represent the views of IRIS Media Works and Advisorpedia. Readers should not consider statements made by the contributor as formal recommendations and should consult their financial advisor before making any investment decisions. To read our full disclosure, please click here.